Code4Lib Conference, 2011

March 12th, 2011

This posting documents my experience at the 2011 Code4Lib Conference, February 8-10 in Bloomington (Indiana). In a sentence, the Conference was well-organized, well-attended, and demonstrated the over-all health and vitality of this loosely structured community. At the same time I think the format of the Conference will need to evolve if it expects to significantly contribute to the library profession.

student center
student center
computers
computers
Code4Libbers
Code4Libbers

Day #1 (Tuesday, February 8)

The Conference officially started on Tuesday, February 8 after the previous day’s round of pre-conference activities. Brad Wheeler (Indiana University) gave the introductory remarks. He alluded to the “new normal”, and said significant change only happens when there are great leaders or financial meltdowns such as the one we are currently experiencing. In order to find stability in the current environment he advocated true dependencies and collaborations, and he outlined three tensions: 1) innovation versus solutions at scale, 2) local-ness and cloudiness, and 3) propriety verus open. All of these things, he said, are false dichotomies. “There needs to be a balance and mixture of all these tension.” Wheeler used his experience with Kuali as an example and described personal behavior, a light-weight organization, and local goals as the “glue” making Kuali work. Finally, he said the library community needs to go beyond “toy” projects and create something significant.

The keynote address, Critical collaborations: Programmers and catalogers? Really?, was given by Diane Hillman (Metadata Management). In it she advocated greater collaboration between the catalogers and coders. “Catalogers and coders do not talk with each other. Both groups get to the nitty-gritty before their is an understanding of the problem.” She said change needs to happen, and it should start within our own institutions by learning new skills and having more cross-departmental meetings. Like Wheeler, she had her own set of tensions: 1) “cool” services versus the existing online public access catalog, and 2) legacy data versus prospective data. She said both communities have things to learn from each other. For example, catalogers need to learn to use data that is not created by catalogers, and catalogers need not always look for leadership from “on high”. I asked what the coders needed to learn, but I wasn’t sure what the answer was. She strongly advocated RDA (Resource Description and Access), and said, “It is ready.” I believe she was looking to the people in the audience as people who could create demonstration projects to show to the wider community.

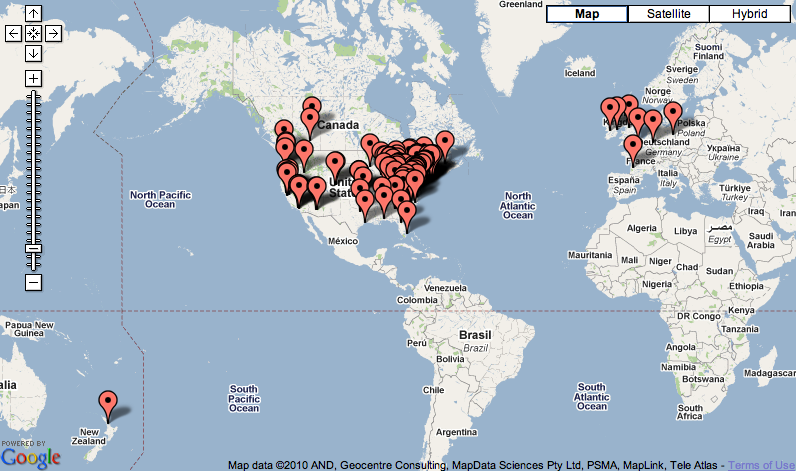
Karen Coombs (OCLC) gave the next presentation, Visualizing library data. In it she demonstrated a number of ways library information can be graphed through the use of various mash-up technologies: 1) a map of holdings, 2) QR codes describing libraries, 3) author timelines, 4) topic timelines, 5) FAST headings in a tag cloud, 6) numbers of libraries, 7) tree relationships between terms, and 8) pie charts of classifications. “Use these things to convey information that is not a list of words”.

In Hey, Dilbert, where’s my data?”, Thomas Barker (University of Pennsylvania) described how he is aggregating various library data sets into a single source for analysis — http://code.google.com/p/metridoc/

Tim McGeary (Lehigh University) shared a Kuali update in Kuali OLE: Architecture of diverse and linked data. OLE (Open Library Environment) is the beginnings of an open source library management system. Coding began this month (February) with goals to build community, implement a “next-generation library catalog”, re-examine business operations, break away from print models of doing things, create an enterprise-level system, and reflect the changes in scholarly work. He outlined the structure of the system and noted three “buckets” for holding different types of content: 1) descriptive — physical holdings, 2) semantic — conceptual content, and 3) relational — financial information. They are scheduled to release their first bits of code by July.

Cary Gordon (The Cherry Hill Company) gave an overview of Drupal 7 functionality in Drupal 7 as a rapid application development tool. Of most interest to me was the Drupal credo, “Sacrifice the API. Preserve the data.” In the big scheme of things, this makes a lot of sense to me.

After lunch first up was Josh Bishoff (University of Illinois) with Enhancing the mobile experience: mobile library services at Illinois. The most important take-away was the importance between a mobile user experience and a desktop user experience. They are not the same. “This is not a software problem but rather an information architecture problem.”

Scott Hanrath (University of Kansas) described his participation in the development of Anthologize in One week, one tool: Ultra-rapid open sources development among strangers. He enumerated the group’s three criteria for success: 1) usefulness, 2) low walls & high ceilings, and 3) feasibility. He also attributed the project’s success to extraordinary outreach efforts — marketing, good graphic design, blurbs, logos, etc.

cabin
cabin
graveyard
graveyard
church
chruch

VuFind beyond MARC: Discovering everything else by Demian Katz (Villanova University) described how VuFind supports the indexing of non-MARC metadata through the use of “record drivers”. Acquire metadata. Map it to Solr fields. Index it while denoting it as a special metadata type. Search. Branch according to metadata type. Display. He used Dublin Core OAI-PMH metadata as an example.

The last formal presentation of the day was entitled Letting in the light: Using Solr as an external search component by Jay Luker and Benoit Thiell (Astrophysics Data System). ADS is a bibliographic information system for astronomers. It uses a pre-print server originally developed at CERN. They desired to keep much of the functionality of the original server as possible but enhance it with Solr indexing. They described how they hacked the two systems to allow the searching and retrieving of millions of records at a time. Of all the presentations at the Conference, this one was the most computer science-like.

The balance of the day was given over to breakout sessions, lightning talks, a reception in the art museum, and craft beer drinking in the hospitality suite. Later that evening I retired to my room and hacked on Twitter feeds. “What do library programmers do for a good time?”

Day #2 (Wednesday, February 9)

The next day began with a presentation by my colleagues at Notre Dame, Rick Johnson and Dan Brubakerhorst. In A Community-based approach to developing a digital exhibit at Notre Dame using the Hydra Framework, they described how they are building and maintaining a digital library framework based on a myriad of tools: Fedora, Active Fedora, Solr, Hydrangia, Ruby, Blacklight. They gave examples of ingesting EAD files. They are working on an ebook management application. Currently they are building a digitized version of city plans.

I think the most inspiring presentation was by Margaret Heller (Dominican University) and Nell Tayler (Chicago Underground) called Chicago Underground Library’s community-based cataloging system. Tayler began and described a library of gray literature. Poems. Comics. All manner of self publications were being collected and loosely cataloged in order to increase the awareness of the materials and record their existence. The people doing the work have little or no cataloging experience. They decided amongst themselves what metadata they were going to use. They wanted to focus on locations and personal characteristics of the authors/publishers of the material. They whole thing reminded me of the times I suggested cataloging local band posters because somebody will find everything interesting at least once.

Gabriel Farrell (Drexel University) described the use of a non-relational database called CouchDB in Beyond sacrilege: A CouchApp catalog. With a REST-ful interface, complete with change log replication and different views, CouchApp seems to be cool as well as “kewl”.

Matt Zumwalt (MediaShelf) in Opinionated metadata: Bringing a bit o sanity to the world of XML metdata described OM which looked like a programatic way of working with XML in Ruby but I thought his advice on how to write good code was more interesting. “Start with people’s stories, not the schema. Allow the vocabulary to reflect the team. And talk to the other team members.”

Ben Anderson (eXtensible Catalog) in Enhancing the performance of extensibility of XC’s metadata services toolkit outlined the development path and improvements to the Metadata Services Toolkit (MST). He had a goal of making the MST faster and more robust, and he did much of this by taking greater advantage of MySQL as opposed to processing various things in Solr.

wires
wires
power supply
power supply
water cooler
water cooler

In Ask Anything! a.k.a. the ‘Human Search Engine moderated by Dan Chudnov (Library of Congress) a number of people stood up, asked the group a question, and waited for an answer. The technique worked pretty well and enabled many people to identify many others who: 1) had similar problems, or 2) offered solutions. For better or for worse, I asked the group if they had any experience with issues of data curation, and I was “rewarded” for my effort with the responsibility to facilitate a birds-of-a-feather session later in the day.

Standing in for Mike Grave, Tim Shearer (University of North Carolina at Chapel Hill) presented GIS on the cheap. Using different content from different sources, Grave is geo-tagging digital objects by assigning them latitudes and longitudes. Once this is done, his Web interfaces read the tagging and place the objects on a map. He is using a Javascript library called Open Layers for the implementation.

In Let’s get small: A Microservices approach to library websites by Sean Hannan (Johns Hopkins University) we learned how a myriad of tools and libraries are being used by Hannan to build websites. While the number of tools and libraries seemed overwhelming I was impressed at the system’s completeness. He was practicing the Unix Way when it comes to website maintenance.

When a person mentions the word “archives” at a computer conference, one of the next words people increasingly mention is “forensics”, and Mark Matienzo (Yale University) in Fiwalk with me: Building emergent pre-ingest workflows for digital archival records using open source-forensic software described how he uses forensic techniques to read, organize, preserve digital media — specifically hard drives. He advocated a specific workflow for doing his work, a process for analyzing the disk’s content with a program called Gumshoe, and Advanced Forensic Framework 4 (AFF4) for doing forensics against file formats. Ultimately he hopes to write an application binding the whole process together.

I paid a lot of attention to David Lacy (Villanova University) when he presented (Yet another) home-grown digital library system, built upon open source XML technologies and metadata standards because the work he has done directly effects a system I am working on colloquially called the “Catholic Portal”. In his system Lacy described a digital library system complete with METS files, a build process, an XML database, and an OAI-PMH server. Content is digitized, described, and ingested into VuFind. I feel embarrassed that I had not investigated this more thoroughly before.

Break-out (birds-of-a-feather) sessions were up next and I facilitated one on data curation. Between ten and twelve of us participated, and in a nutshell we outlined a whole host of activities and issues surrounding the process of data management. After listing them all and listening to the things discussed more thoroughly by the group I was able to prioritize. (“Librarians love lists.”) At the top was, “We won’t get it right the first time”, and I certainly agree. Data management and data curation are the new kids on the block and consequently represent new challenges. At the same time, our profession seems obsessed with the creation of processes, implementations, and not evaluating the processes as needed. In our increasingly dynamic environment, such a way of thinking is not feasible. We will have to practice. We will have to show our ignorance. We will have to experiment. We will have to take risks. We will have to innovate. All of these things assume imperfection from the get go. At the same time the issues surrounding data management have a whole lot in common with issues surrounding just about any other medium. The real challenge is the application of our traditional skills to the current environment. A close second in the priorities was the perceived need for cross-institutional teams — groups of people including the office of research, libraries, computing centers, legal counsel, and of course researchers who generate data. Everybody has something to offer. Everybody has parts of the puzzle. But no one has all the pieces, all the experience, nor all the resources. Successful data management projects — defined in any number of ways — require skills from across the academe. Other items of note on the list included issues surrounding: human subjects, embargoing, institution repository versus discipline repositories, a host of ontologies, format migration, storage and back-up versus preservation and curation, “big data” and “little data”, entrenching one’s self in the research process, and unfunded mandates.

text mining
text mining

As a part of the second day’s Lighting Talks I shared a bit about text mining. I demonstrated how the sizes of texts — measured in words — could be things we denote in our catalogs thus enabling people to filter results in an additional way. I demonstrated something similar with Fog, Flesch, and Kincaid scores. I illustrated these ideas with graphs. I alluded to the “colorfulness” of texts by comparing & contrasting Thoreau with Austen. I demonstrated the idea of “in the same breath” implemented through network diagrams. And finally, I tried to describe how all of these techniques could be used in our “next generation library catalogs” or “discovery systems”. The associated video, here, was scraped from the high quality work done by the University of Indiana. “Thanks guys!”

At the end of the day we were given the opportunity to visit the University’s data center. It sounded a lot like a busman’s holiday to me so I signed up for the 6 o’clock show. I got on the little bus with a few other guys. One was from Australia. Another was from Florida. They were both wondering whether or not the weather was cold. It being around 10° Fahrenheit I had to admit it was. The University is proud of their data center. It can withstand tornado-strength forces. It is built into the side of a hill. It is only have full, if that, which is another way of saying, “They have a lot of room to expand.” We saw the production area. We saw the research area. I was hoping to see lots of blinking lights and colorful, twisty cables, but the lights were few and the cables were all blue. We saw Big Red. I wanted to see where the network came in. “It is over there, in that room”. Holding up my hands I asked, “How big is the pipe?”. “Not very large,” was the reply, “and the fiber optic cable is only the size of a piece of hair.” It thought the whole thing was incongruous. All this infrastructure and it literally hangs on the end of a thread. One of the few people I saw employed by the data center made a comment while I was taking photographs. “Those are the nicest packaged cables you will ever see.” She was very proud of her handiwork, and I was happy to take a few pictures of them.

Big Red
Big Red
generator
generator
wires
wires

Day #3 (Thursday, February 10)

The last day of the conference began with a presentation by Jason Casden and Joyce Chapman (North Carolina State University Libraries) with Building a open source staff-facing tablet app for library assessment. In it they first described how patron statistics were collected. Lots of paper. Lots of tallies. Lots of data entry. Little overall coordination. To resolve this problem they created a tablet-based tool allowing the statistics collector to roam through the library, quickly tally how many people were located where and doing what, and update a centralized database rather quickly. Their implementation was an intelligent use of modern technology. Kudos.

Ian Mulvany (Medeley) was a bit of an entrepreneur when he presented Medeley’s API and university libraries: Three example to create value on behalf of Jan Reichelt. His tool, Medeley, is intended to solve real problems for scholars: making them more efficient as writers, and more efficient as discoverers. To do this he provides a service where PDF files are saved centrally, analyzed for content, and enhanced through crowd sourcing. Using Medeley’s API things such as reading lists, automatic repository deposit, or “library dashboard” applications could be written. As of this writing Medeley is sponsoring a contest with cash prizes to see who can create the most interesting application from their API. Frankly, the sort of application described by Reichelt is the sort of application I think the library community should have created a few years ago.

In Practical relevancy testing, Naomi Dushay (Stanford University) advocated doing usability testing against the full LAMP stack. To do this she uses a program called Cucumber to design usability tests, run them, look at the results, adjust software configurations, and repeat.

Kevin Clarke (NESCent) in Sharing between data repositories first compared & contrasted two repository systems: Dryad and TreeBase. Both have their respective advantages & disadvantages. As a librarian he understands why it is good idea to have the same content in both systems. To this end he outlined and described how such a goal could be accomplished using a file packaging format called BagIt.

The final presentation of the conference was given by Eric Hellman (Gluejar, Inc) and called Why (Code4) libraries exist. In it he posited that more than half of the books sold in the near future will be in ebook format. If this happens, then, he asked, will libraries become obsolete? His answer was seemingly both no and yes. “Libraries need to change in order to continue to exists, but who will drive this change? Funding agencies? Start-up companies? Publishers? OCLC? ILS vendors?” None of these things, he says. Instead, it may be the coders but we (the Code4Lib community) have a number of limitations. We are dispersed, poorly paid, self-trained, and too practical. In short, none of the groups he outlined entirely have what it takes to keep libraries alive. On the other hand, he said, maybe libraries are not really about books. Instead, maybe, they are about space, people, and community. In the end Hellman said, “We need to teach, train, and enable people to use information.”

conference center
conference center
bell
bell
hidden flywheel
hidden flywheel

Summary

All in all the presentations were pretty much what I expected and pretty much what was intended. Everybody was experiencing some sort of computing problem in their workplace. Everybody used different variations of the LAMP stack (plus an indexer) to solve their problems. The presenters shared their experience with these solutions. Each presentation was like variations of a 12-bar blues. A basic framework is assumed, and the individual uses the framework to accomplish to create beauty. If you like the idea of the blues framework, then you would have liked the Code4Lib presentations. I like the blues.

In the past eight months I’ve attended at least four professional conferences: Digital Humanities 2010 (July), ECDL 2010 (September), Data Curation 2010 (December), and Code4Lib 2011 (February). Each one had about 300 people in attendance. Each one had something to do with digital libraries. Two were more academic in nature. Two were more practical. All four were communities unto themselves; at each conference there were people of the in-crowd, new comers, and folks in between. Many, but definitely not most, of the people I saw were a part of the other conferences but none of them were at all four. All of the conferences shared a set of common behavioral norms and at the same time owned a set of inside jokes. We need to be careful and not go around thinking our particular conference or community is the best. Each has something to offer the others. I sincerely do not think there is a “best” conference.

The Code4Lib community has a lot to offer the wider library profession. If the use of computers in libraries is only going to grow (which is an understatement), then a larger number of people who practice librarianship will need/want to benefit from Code4Lib’s experience. Yet the existing Code4Lib community is reluctant to change the format of the conference to accomodate a greater number of people. Granted, larger numbers of attendees make it more difficult to find venues, enable a single shared conference experience, and necessitates increased governance and bureaucracy. Such are the challenges of a larger group. I think the Code4Lib community is growing and experiencing growing pains. The mailing list increases by at least one or two new subscribers every week. The regional Code4Lib meetings continue. The journal is doing just fine. Code4Lib is a lot like the balance of the library profession. Practical. Accustomed to working on a shoe string. Service oriented. Without evolving in some way, the knowledge of Code4Libbers is not going to have a substancial effect on the wider library community. This makes me sad.

Next year’s conference — Code4Lib 2012 — will be held in Seattle (Washington). See you there?

wires
wires
self-portrait
self-portrait

Foray’s into parts-of-speech

February 5th, 2011

This posting is the first of my text mining essays focusing on parts-of-speech. Based on the most rudimentary investigations, outlined below, it seems as if there is not much utility in the classification and description of texts in terms of their percentage use of parts-of-speech.

Background

For the past year or so I have spent a lot of my time counting words. Many of my friends and colleagues look at me strangely when I say this. I have to admit, it does sound sort of weird. On the other hand, the process has enabled me to easily compare & contrast entire canons in terms of length and readability, locate statistically significant words & phrases in individual works, and visualize both with charts & graphs. Through the process I have developed two Perl modules (Lingua::EN::Ngram and Lingua::Concordance), and I have integrated them into my Alex Catalogue of Electronic Texts. Many people are still skeptical about the utility of these endeavors, and my implementations do not seem to be compelling enough to sway their opinions. Oh well, such is life.

My ultimate goal is to figure out ways to exploit the current environment and provide better library service. The current environment is rich with full text. It abounds. I ask myself, “How can I take advantage of this full text to make the work of students, teachers, and scholars both easier and more productive?” My current answer surrounds the creation of tools that take advantage of the full text — making it easier for people to “read” larger quantities of information, find patterns in it, and through the process create new knowledge.

Much of my work has been based on rudimentary statistics with little regard to linguistics. Through the use of computers I strive to easily find patterns of meaning across works — an aspect of linguistics. I think such a thing is possible because the use of language assumes systems and patterns. If it didn’t then communication between ourselves would be impossible. Computers are all about systems and patterns. They are very good at counting and recording data. By using computers to count and record characteristics of texts, I think it is possible to find patterns that humans overlook or don’t figure as significant. I would really like to take advantage of core reference works which are full of meaning — dictionaries, thesauri, almanacs, biographies, bibliographies, gazetteers, encyclopedias, etc. — but the ambiguous nature of written language makes the automatic application of such tools challenging. By classifying individual words as parts-of-speech (POS), some of this ambiguity can be reduced. This posting is my first foray into this line of reasoning, and only time will tell if it is fruitful.

Comparing parts-of-speech across texts

My first experiment compares & contrasts POS usage across texts. “To what degree are there significant differences between authors’ and genres’ usage of various parts-of-speech?”, I asked myself. “Do some works contain a greater number of nouns, verbs, and adjectives than others?” If so, then maybe this would be one way to differentiate works, and make it easier for the student to both select a work for reading as well as understand its content.

POS tagging

To answer these questions, I need to first identify the POS in a document. In the English language there are eight generally accepted POS: 1) nouns, 2) pronouns, 3) verbs, 4) adverbs, 5) adjectives, 6) prepositions, 7) conjunctions, and 8) interjections. Since I am a “lazy Perl programmer”, I sought a POS tagger and in the end settled on one called Lingua::TreeTagger — a full-featured wrapper around a command line driven application called Tree Tagger. Using a process called the Hidden Markov Model, TreeTagger systematically goes through a document and guesses the POS for a given word. According to the research, it can do this with 96% accuracy because is has accurately modeled the systems and patterns of the English language alluded to above. For example, it knows that sentences begin with capital letters and end with punctuation marks. It knows that capitalized words in the middle of sentences are the names of things and the names of things are nouns. It knows that most adverbs end in “ly”. It knows that adjectives often precede nouns. Similarly, it knows the word “the” also precedes nouns. In short, it has done its best to model the syntactical nature of a number of languages and it uses these models to denote the POS in a document.

For example, below is the first sentence from Abraham Lincoln’s Gettysburg Address:

Four score and seven years ago our fathers brought forth on this continent, a new nation, conceived in Liberty, and dedicated to the proposition that all men are created equal.

Using Lingua::TreeTagger it is trivial to convert the sentence into the following XML snippet where each element contains two attributes (a lemma of the word in question and its POS) and the word itself:

<pos><w lemma="Four" type="CD">Four</w> <w lemma="score" type="NN">score</w> <w lemma="and" type="CC">and</w> <w lemma="seven" type="CD">seven</w> <w lemma="year" type="NNS">years</w> <w lemma="ago" type="RB">ago</w> <w lemma="our" type="PP$">our</w> <w lemma="father" type="NNS">fathers</w> <w lemma="bring" type="VVD">brought</w> <w lemma="forth" type="RB">forth</w> <w lemma="on" type="IN">on</w> <w lemma="this" type="DT">this</w> <w lemma="continent" type="NN">continent</w> <w lemma="," type=",">,</w> <w lemma="a" type="DT">a</w> <w lemma="new" type="JJ">new</w> <w lemma="nation" type="NN">nation</w> <w lemma="," type=",">,</w> <w lemma="conceive" type="VVN">conceived</w> <w lemma="in" type="IN">in</w> <w lemma="Liberty" type="NP">Liberty</w> <w lemma="," type=",">,</w> <w lemma="and" type="CC">and</w> <w lemma="dedicate" type="VVN">dedicated</w> <w lemma="to" type="TO">to</w> <w lemma="the" type="DT">the</w> <w lemma="proposition" type="NN">proposition</w> <w lemma="that" type="IN/that">that</w> <w lemma="all" type="DT">all</w> <w lemma="man" type="NNS">men</w> <w lemma="be" type="VBP">are</w> <w lemma="create" type="VVN">created</w> <w lemma="equal" type="JJ">equal</w> <w lemma="." type="SENT">.</w></pos>

Each POS is represented by a different code. TreeTagger uses as many as 58 codes. Some of the less obscure are: CD for cardinal number, CC for conjunction, NN for noun, NNS for plural noun, JJ for adjective, VBP for the verb to be in the third-person plural, etc.

Using a slightly different version of the same trivial code, Lingua::TreeTagger can output a delimited stream where each line represents a record and the delimited values are words, lemmas, and POS. The first ten records from the sentence above are displayed below:

Word Lemma POS
Four Four CD
score score NN
and and CC
seven seven CD
years year NNS
ago ago RB
our our PP$
fathers father NNS
brought bring VVD
forth forth RB

In the end I wrote a simple program — tag.pl — taking a file name as input and streaming to standard output the tagged text in delimited form. Executing the code and saving the output to a file is simple:

$ bin/tag.pl corpus/walden.txt > pos/walden.pos

Consequently, I now have a way to quickly and easily denote the POS for each word in a given plain text file.

Counting and summarizing

Now that the POS of a given document are identified, the next step is to count and summarize them. Counting is something at which computers excel, and I wrote another program — summarize.pl — to do the work. The program’s input takes the following form:

summarize.pl <all|simple|other|pronouns|nouns|verbs|adverbs|adjectives> <t|l> <filename>

The first command line argument denotes what POS will be output. “All” denotes the POS defined by Tree Tagger. “Simple” denotes Tree Tagger POS mapped to the eight generally accepted POS of the English language. The use of “nouns”, “pronouns”, “verbs”, “adverbs”, and “adjectives” tells the script to output the tokens (words) or lemmas in each of these classes.

The second command line argument tells the script whether to tally tokens (words) or lemmas when counting specific items.

The last argument is the file to read, and it is expected to be in the form of tag.pl’s output.

Using summarize.pl to count the simple POS in Lincoln’s Address, the following output is generated:

$ summarize.pl simple t address.pos
noun 41
pronoun 29
adjective 21
verb 51
adverb 31
determiner 35
preposition 39
conjunction 11
interjection 0
symbol 2
punctuation 39
other 11

In other words, of the 272 words found in the Gettysburg Address 41 are nouns, 29 are pronouns, 21 are adjectives, etc.

Using a different from of the script, a list of all the pronouns in the Address, sorted by the number of occurances, can be generated:

$ summarize.pl pronouns t address.pos
we 10
it 5
they 3
who 3
us 3
our 2
what 2
their 1

In other words, the word “we” — a particular pronoun — was used 10 times in the Address.

Consequently, I now have tool enabling me to count the POS in a document.

Preliminary analysis

I now have the tools necessary to answer one of my initial questions, “Do some works contain a greater number of nouns, verbs, and adjectives than others?” To answer this I collected nine sets of documents for analysis:

  1. Henry David Thoreau’s Excursions (73,734 words; Flesch readability score: 57 )
  2. Henry David Thoreau’s Walden (106,486 words; Flesch readability score: 55 )
  3. Henry David Thoreau’s A Week on the Concord and Merrimack Rivers (117,670 words; Flesch readability score: 56 )
  4. Jane Austen’s Sense and Sensibility (119,625 words; Flesch readability score: 54 )
  5. Jane Austen’s Northanger Abbey (76,497 words; Flesch readability score: 58 )
  6. Jane Austen’s Emma (156,509 words; Flesch readability score: 60 )
  7. all of the works of Plato (1,162,460 words; Flesch readability score: 54 )
  8. all of the works of Aristotle (950,078 words; Flesch readability score: 50 )
  9. all of the works of Shakespeare (856,594 words; Flesch readability score: 72 )

Using tag.pl I created POS files for each set of documents. I then used summary.pl to output counts of the simple POS from each POS file. For example, after creating a POS file for Walden, I summarized the results and learned that it contains 23,272 nouns, 10,068 pronouns, 8,118 adjectives, etc.:

$ summarize.pl simple t walden.pos
noun 23272
pronoun 10068
adjective 8118
verb 17695
adverb 8289
determiner 13494
preposition 16557
conjunction 5921
interjection 37
symbol 997
punctuation 14377
other 2632

I then copied this information into a spreadsheet and calculated the relative percentage of each POS discovering that 19% of the words in Walden are nouns, 8% are pronouns, 7% are adjectives, etc. See the table below:

POS %
noun 19
pronoun 8
adjective 7
verb 15
adverb 7
determiner 11
preposition 14
conjunction 5
interjection 0
symbol 1
punctuation 12
other 2

I repeated this process for each of the nine sets of documents and tabulated them here:

POS Excursions Rivers Walden Sense Northanger Emma Aristotle Shakespeare Plato Average
noun 20 20 19 17 17 17 19 25 18 19
verb 14 14 15 16 16 17 15 14 15 15
punctuation 13 13 12 15 15 15 11 16 13 14
preposition 13 13 14 13 13 12 15 9 14 13
determiner 12 12 11 7 8 7 13 6 11 10
pronoun 7 7 8 12 11 11 5 11 7 9
adverb 6 6 7 8 8 8 6 6 6 7
adjective 7 7 7 5 6 6 7 5 6 6
conjunction 5 5 5 3 3 3 5 3 6 4
other 2 2 2 3 3 3 3 3 3 3
symbol 1 1 1 1 1 0 1 2 1 1
interjection 0 0 0 0 0 0 0 0 0 0
Percentage and average of parts-of-speech usage in 9 works or corpra

The result was very surprising to me. Despite the wide range of document sizes, and despite the wide range of genres, the relative percentages of POS are very similar across all of the documents. The last column in the table represents the average percentage of each POS use. Notice how the each individual POS value differs very little from the average.

This analysis can be illustrated in a couple of ways. First, below are nine pie charts. Each slice of each pie represents a different POS. Notice how all the dark blue slices (nouns) are very similar in size. Notice how all the red slices (verbs), again, are very similar. The only noticeable exception is in Shakespeare where there is a greater number of nouns and pronouns (dark green).


Thoreau’s Excursions

Thoreau’s Walden

Thoreau’s Rivers

Austen’s Sense

Austen’s Northanger

Austen’s Emma

all of Plato

all of Aristotle

all of Shakespeare

The similarity across all the documents can be further illustrated with a line graph:

Across the X axis is each POS. Up and down the Y axis is the percentage of usage. Notice how the values for each POS in each document are closely clustered. Each set of documents uses relatively the same number of nouns, pronouns, verbs, adjectives, adverbs, etc.

Maybe such a relationship between POS is one of the patterns of well-written documents? Maybe it is representative of works standing the test of time? I don’t know, but I doubt I am the first person to make such an observation.

Conclusion

My initial questions were, “To what degree are there significant differences between authors’ and genres’ usage of various parts-of-speech?” and “Do some works contain a greater number of nouns, verbs, and adjectives than others?” Based on this foray and rudimentary analysis the answers are, “No, there are not significant differences, and no, works do not contain different number of nouns, verbs, adjectives, etc.”

Of course, such a conclusion is faulty without further calculations. I will quite likely commit an error of induction if I base my conclusions on a sample of only nine items. While it would require a greater amount of effort on my part, it is not beyond possibility for me to calculate the average POS usage for every item in my Alex Catalogue. I know there will be some differences — especially considering the items having gone through optical character recognition — but I do not know the degree of difference. Such an investigation is left for a later time.

Instead, I plan to pursue a different line of investigation. The current work examined how texts were constructed, but in actuality I am more interested in the meanings works express. I am interested in what they say more than how they say it. Such meanings may be gleaned not so much from gross POS measurements but rather the words used to denote each POS. For example, the following table lists the 10 most frequently used pronouns and the number of times they occur in four works. Notice the differences:

Walden Rivers Northanger Sense
I (1,809) it (1,314) her (1,554) her (2,500)
it (1,507) we (1,101) I (1,240) I (1,917)
my (725) his (834) she (1,089) it (1,711)
he (698) I (756) it (1,081) she (1,553)
his (666) our (677) you (906) you (1,158)
they (614) he (649) he (539) he (1,068)
their (452) their (632) his (524) his (1,007)
we (447) they (632) they (379) him (628)
its (351) its (487) my (342) my (598)
who (340) who (352) him (278) they (509)

While the lists are similar, they are characteristic of work from which they came. The first — Walden — is about an individual who lives on a lake. Notice the prominence of the word “I” and “my”. The second — Rivers — is written by the same author as the first but is about brothers who canoe down a river. Notice the higher occurrence of the word “we” and “our”. The later two works, both written by Jane Austin, are works with females as central characters. Notice how the words “her” and “she” appear in these lists but not in the former two. (Compare these lists of pronouns with the list from Lincoln’s Address and even more interesting things appear.) It looks as if there are patterns or trends to be measured here.

‘More later.

Visualizing co-occurrences with Protovis

January 9th, 2011

This posting describes how I am beginning to visualize co-occurrences with a Javascript library called Protovis. Alternatively, I an trying to answer the question, “What did Henry David Thoreau say in the same breath when he used the word ‘walden’?”

“In the same breath”

Network diagrams are great ways to illustrate relationships. In such diagrams nodes represent some sort of entity, and lines connecting nodes represent some sort of relationship. Nodes clustered together and sharing many lines denote some kind of similarity. Conversely, nodes whose lines are long and not interconnected represent entities outside the norm or at a distance. Network diagrams are a way of visualizing complex relationships.

Are you familiar with the phrase “in the same breath”? It is usually used to denote the relationship between one or more ideas. “He mentioned both ‘love’ and ‘war’ in the same breath.” This is exactly one of the things I want to do with texts. Concordances provide this sort of functionality. Given a word or phrase, a concordance will find the query in a corpus and display the words on either side of it. A KWIK (key word in context) index, concordances make it easier to read how words or phrases are used in relationship with their surrounding words. The use of network diagrams seem like good idea to see — visualize — how words or phrases are used within the context of surrounding words.

Protovis is a Javascript charting library developed by the Stanford Visualization Group. Using Protovis a developer can create all sorts of traditional graphs (histograms, box plots, line charts, pie charts, scatter plots) through a relatively easy-to-learn API (application programmer interface). One of the graphs Protovis supports is an interactive simulation of network diagrams called “force-directed layouts“. After experiencing some of the work done by a few of my colleagues (“Thank you Michael Clark and Ed Summers“), I wondered whether or not network diagrams could be used to visualize co-occurrences in texts. After discovering Protovis, I decided to try to implement something along these lines.

Implementation

The implementation of the visualization requires the recursive creation of a term matrix. Given a word (or regular expression), find the query in a text (or corpus). Identify and count the d most frequently used words within b number of characters. Repeat this process d times with each co-occurrence. For example, suppose the text is Walden by Henry David Thoreau, the query is “spring”, d is 5, and b is 50. The implementation finds all the occurrences of the word “spring”, gets the text 50 characters on either side of it, finds the 5 most commonly used words in those characters, and repeats the process for each of those words. The result is the following matrix:

spring day morning first winter
day days night every today
morning spring say day early
first spring last yet though
winter summer pond like snow

Thus, the most common co-occurrences for the word “spring” are “day”, “morning”, “first”, and “winter”. Each of these co-occurrences are recursively used to find more co-occurrences. In this example, the word “spring” co-occurs with times of day and seasons. These words then co-occur with more times of day and more seasons. Similarities and patterns being to emerge. Depending on the complexity of a writer’s sentence structure, the value of b (“breath”) may need to be increased or decreased. As the value of d (“detail”) is increased or decreased so does the number of co-occurrences to return.

Once this matrix is constructed, Protovis requires it to be converted into a simple JSON (Javascript Object Notation) data structure. In this example, “spring” points to “day”, “morning”, “first”, and “winter”. “Day” points to “days”, “night”, “every”, and “today”. Etc. As terms point to multiples of other terms, a network diagram is manifested, and the magic of Protovis is put to work. See the following illustration:

spring in walden
“spring” in Walden

It is interesting enough to see the co-occurrences of any given word in a text, but it is even more interesting to compare the co-occurrences between texts. Below are a number of visualizations from Thoreau’s Walden. Notice how the word “walden” frequently co-occurs with the words “pond”, “water”, and “woods”. This makes a lot of sense because Walden Pond is a pond located in the woods. Notice how the word “fish” is associated with “pond”, “fish”, and “fishing”. Pretty smart, huh?

walden in walden
“walden” in Walden
fish in walden
“fish” in Walden
woodchuck in walden
“woodchuck” in Walden
woods in walden
“woods” in Walden

Compare these same words with the co-occurrences in a different work by Thoreau, A Week on the Concord and Merrimack Rivers. Given the same inputs the outputs are significantly different. For example, notice the difference in co-occurrences given the word “woodchuck”.

walden in rivers
“walden” in Rivers
fish in rivers
“fish” in Rivers
woodchuck in walden
“woodchuck” in Rivers
woods in rivers
“woods” in Rivers

Give it a try

Give it a try for yourself. I have written three CGI scripts implementing the things outlined above:

In each implementation you are given the opportunity to input your own queries, define the “size of the breath”, and the “level of detail”. The result is an interactive network diagram visualizing the most frequent co-occurrences of a given term.

The root of the Perl source code is located at http://infomotions.com/sandbox/network-diagrams/.

Implications for librarianship

The visualization of co-occurrences obviously has implications for text mining and the digital humanities, but it also has implications for the field of librarianship.

Given the current environment where data and information abound in digital form, libraries have found themselves in an increasingly competitive environment. What are libraries to do? Lest they become marginalized, librarians can not rest on their “public good” laurels. Merely providing access to information is not good enough. Everybody feels as if they have plenty of access to information. What is needed are methods and tools for making better use of the data and information they acquire. Implementing text mining and visualization interfaces are one way to accomplish that goal within context of online library services. Do a search in the “online catalog”. Create a subset of interesting content. Click a button to read the content from a distance. Provide ways to analyze and summarize the content thus saving the time of the reader.

Us librarians have to do something differently. Think like an entrepreneur. Take account of your resources. Examine the environment. Innovate and repeat.

MIT’s SIMILE timeline widget

December 20th, 2010

For a good time, I took a stab at learning how to implement a MIT SIMILE timeline widget. This posting describes what I learned.

Background

The MIT SIMILE Widgets are a set of cool Javascript tools. There are tools for implementing “exhibits”, time plots, “cover flow” displays a la iTunes, a couple of other things, and interactive timelines. I have always had a fondness for timelines since college when I created one to help me study for my comprehensive examinations. Combine this interest with the rise of digital humanities and my belief that library data is too textual in nature, I decided to learn how to use the timeline widget. Maybe this tool can be used in Library Land?

timeline
Screen shot of local timeline implementation

Implementation

The family of SIMILE Widgets Web pages includes a number of sample timelines. By playing with the examples you can see the potencial of the tool. Going through the Getting Started guide was completely necessary since the Widget documentation has been written, re-written, and moved to other platforms numerous times. Needless to say, I found the instructions difficult to use. In a nutshell, using the Timeline Widget requires the developer to:

  1. load the libraries
  2. create and modify a timeline object
  3. create a data file
  4. load the data file
  5. render the timeline

Taking hints from “timelines in the wild“, I decided to plot my writings — dating from 1989 to the present. Luckily, just about all of them are available via RSS (Really Simple Syndication), and they include:

Consequently, after writing my implementation’s framework, the bulk of the work was spent converting RSS files into an XML file the widget could understand. In the end I:

  • created an HTML file complete with the widget framework
  • downloaded the totality of RSS entries from all my my RSS feeds
  • wrote a slightly different XSL file for each RSS feed
  • wrote a rudimentary shell script to loop through each XSL/RSS combination and create a data file
  • put the whole thing on the Web

You can see the fruits of these labors on a page called Eric Lease Morgan’s Writings Timeline, and you can download the source code — timeline-2010-12-20.tar.gz. From there a person can scroll backwards and forwards in time, click on events, read an abstract of the writing, and hyperlink to the full text. The items from the Water Collection work in the same way but also include a thumbnail image of the water. Fun!?

Take-aways

I have a number of take-aways. First, my implementation is far from perfect. For example, the dates from the Water Collection are not correctly formatted in the data file. Consequently, different Javascript interpreters render the dates differently. Specifically, the Water Collection links to not show up in Safari, but they do show up in Firefox. Second, the timeline is quite cluttered in some places. There has got to be a way to address this. Third, timelines are a great way to visualize events. From the implementation you can readily see what how often I was writing and on what topics. The presentation makes so much more sense compared to a simple list sorted by date, title, or subject terms.

Library “discovery systems” could benefit from the implementation of timelines. Do a search. Get back a list of results. Plot them on a timeline. Allow the learner, teacher, or scholar to visualize — literally see — how the results of their query compare to one another. The ability to visualize information hinges on the ability to quantify information characteristics. In this case, the quantification is a set of dates. Alas, dates in our information systems are poorly recorded. It seems as if we — the library profession — have made it difficult for ourselves to participate in the current information environment.

Illustrating IDCC 2010

December 8th, 2010

This posting illustrates the “tweets” assigned to the hash tag #idcc10.

I more or less just got back from the 6th International Data Curation Conference that took place in Chicago (Illinois). Somewhere along the line I got the idea of applying digital humanities computing techniques against the conference’s Twitter feed — hash tag #idcc10. After installing a Perl module implementing the Twitter API (Net::Twitter::Lite), I wrote a quick hack, fed the results to Wordle, and got the following word cloud:

idcc10

What sorts of conclusions can you make based on the content of the graphic?

The output static and rudimentary. What I’d really like to do is illustrate the tweets over time. Get the oldest tweets. Illustrate the result. Get the newer tweets. Update the illustration. Repeat for all the tweets. Done. In the end I see some sort of moving graphic where significant words represent bubbles. The size of the bubbles grow in size depending on number of times they are used. Each bubble is attached to other bubbles with a line representing associations. The color of the bubbles might represent parts of speech. Using this technique a person could watch the ebb and flow of the virtual conversation.

For a good time time, you can also download the Perl script used to create the textual output. Called twitter.pl, it is only forty-three lines long and many of those lines are comments.

Ruler & Compass by Andrew Sutton

December 5th, 2010

I most thoroughly enjoyed reading and recently learning from a book called Ruler & Compass by Andrew Sutton.

The other day, while perusing the bookstore for a basic statistics book, I came across Ruler & Compass by Andrew Sutton. Having always been intrigued by geometry and the use of only a straight edge and compass to describe a Platonic cosmos, I purchased this very short book, a ruler, and a compass with little hesitation. I then rushed home to draw points, lines, and circles for the purposes of constructing angles, perpendiculars, bisected angles, tangents, all sorts of regular polygons, and combinations of all the above to create beautiful geometric patterns. I was doing mathematics, but not a single number was to be seen. Yes, I did create ratios but not with integers, and instead with the inherent lengths of lines. Facinating!

triangle
square pentagon
hexagon elipse “golden” ratio

Geometry is not a lot unlike both music and computer programming. All three supply the craftsman with a set of basic tools. Points. Lines. Circles. Tones. Durations. Keys. If-then statements. Variables. Outputs. Given these “things” a person is empowered to combine, compound, synthesize, analyze, create, express, and describe. They are mediums for both the artist and scientists. Using them effectively requires thinking as well as “thinquing“. All three are arscient processes.

Anybody could benefit by reading Sutton’s book and spending a few lovely hours practicing the geometric constructions contained therein. I especially recommend this activity to my fellow librarians. The process is not only intellectually stimulating but invigorating. Librarianship is not all about service or collections. It is also about combining and reconstituting core principles — collection, organization, preservation, and dissemination. There is an analogy to be waiting to be seen here. Reading and doing the exercises in Ruler & Compass will make this plainly visible.

Text mining Charles Dickens

December 4th, 2010

This posting outlines how a person can do a bit of text mining against three works by Charles Dickens using a set of two Perl modules — Lingua::EN::Ngram and Lingua::Concordance.

Lingua::EN::Ngram

I recently wrote a Perl module called Lingua::EN::Ngram. Its primary purpose is to count all the ngrams (two-word phrases, three-word phrases, n-word phrases, etc.) in a given text. For two-word phrases (bigrams) it will order the output according to a statistical probability (t-score). Given a number of texts, it will count the ngrams common across the corpus. As of version 0.02 it supports non-ASCII characters making it possible to correctly read and parse a greater number of Romantic languages — meaning it correctly interprets characters with diacritics. Lingua::EN::Ngram is available from CPAN.

Lingua::Concordance

Concordances are just about the oldest of textual analysis tools. Originally developed in the Late Middle Ages to analyze the Bible, they are essentially KWIC (keyword in context) indexes used to search and display ngrams within the greater context of a work. Given a text (such as a book or journal article) and a query (regular expression), Lingua::Concordance can display the occurrences of the query in the text as well as map their locations across the entire text. In a previous blog posting I used Lingua::Concordance to compare & contrast the use of the phrase “good man” in the works of Aristotle, Plato, and Shakespeare. Lingua::Concordance too is available from CPAN.

Charles Dickens

In keeping with the season, I wondered about Charles Dickens’s A Christmas Carol. How often is the word “Christmas” used in the work and where? In terms of size, how does A Christmas Carol compare to some of other Dickens’s works? Are there sets of commonly used words or phrases between those texts?

Answering the first question was relatively easy. The word “Christmas” is occurs eighty-six (86) times, and twenty-two (22) of those occurrences are in the the first ten percent (10%) of the story. The following bar chart illustrates these facts:

bar chart

The length of books (or just about any text) measured in pages in ambiguous, at best. A much more meaningful measure is number of words. The following table lists the sizes, in words, of three Dickens stories:

story size in words
A Christmas Carol 28,207
Oliver Twist 156,955
David Copperfield 355,203

For some reason I thought A Christmas Carol was much longer.

A long time ago I calculated the average size (in words) of the books in my Alex Catalogue. Once I figured this out, I discovered I could describe items in the collection based on relative sizes. The following “dial” charts bring the point home. Each one of the books is significantly different in size:

christmas carol
A Christmas Carol
oliver twist
Oliver Twist
david copperfield
David Copperfield

If a person were pressed for time, then which story would you be able to read?

After looking for common ngrams between texts, I discovered that “taken with a violent fit of” appears both David Copperfield and A Christmas Carol. Interesting!? Moreover, the phrase “violent fit” appears on all three works. Specifically, characters in these three Dickens stories have violent fits of laughter, crying, trembling, and coughing. By concatenating the stories together and applying concordancing methods I see there are quite a number of violent things in the three stories:

  n such breathless haste and violent agitation, as seemed to betoken so
  ood-night, good-night!' The violent agitation of the girl, and the app
  sberne) entered the room in violent agitation. 'The man will be taken,
  o understand that, from the violent and sanguinary onset of Oliver Twi
  one and all, to entertain a violent and deeply-rooted antipathy to goi
  eep a little register of my violent attachments, with the date, durati
  cal laugh, which threatened violent consequences. 'But, my dear,' said
  in general, into a state of violent consternation. I came into the roo
  artly to keep pace with the violent current of her own thoughts: soon 
  ts and wiles have brought a violent death upon the head of one worth m
   There were twenty score of violent deaths in one long minute of that 
  id the woman, making a more violent effort than before; 'the mother, w
   as it were, by making some violent effort to save himself from fallin
  behind. This was rather too violent exercise to last long. When they w
   getting my chin by dint of violent exertion above the rusty nails on 
  en who seem to have taken a violent fancy to him, whether he will or n
  peared, he was taken with a violent fit of trembling. Five minutes, te
  , when she was taken with a violent fit of laughter; and after two or 
  he immediate precursor of a violent fit of crying. Under this impressi
  and immediately fell into a violent fit of coughing: which delighted T
  of such repose, fell into a violent flurry, tossing their wild arms ab
   and accompanying them with violent gesticulation, the boy actually th
  ght I really must have laid violent hands upon myself, when Miss Mills
   arm tied up, these men lay violent hands upon him -- by doing which, 
   every aggravation that her violent hate -- I love her for it now -- c
   work himself into the most violent heats, and deliver the most wither
  terics were usually of that violent kind which the patient fights and 
   me against the donkey in a violent manner, as if there were any affin
   to keep down by force some violent outbreak. 'Let me go, will you,--t
  hands with me - which was a violent proceeding for him, his usual cour
  en.' 'Well, sir, there were violent quarrels at first, I assure you,' 
  revent the escape of such a violent roar, that the abused Mr. Chitling
  t gradually resolved into a violent run. After completely exhausting h
  , on which he ever showed a violent temper or swore an oath, was this 
  ullen, rebellious spirit; a violent temper; and an untoward, intractab
  fe of Oliver Twist had this violent termination or no. CHAPTER III REL
  in, and seemed to presage a violent thunder-storm, when Mr. and Mrs. B
  f the theatre, are blind to violent transitions and abrupt impulses of
  ming into my house, in this violent way? Do you want to rob me, or to

These observations simply beg other questions. Is violence a common theme in Dickens works? What other adjectives are used to a greater or lesser degree in Dickens works? How does the use of these adjectives differ from other authors of the same time period or within the canon of English literature?

Summary

The combination of the Internet, copious amounts of freely available full text, and ubiquitous as well as powerful desktop computing, it is now possible to analyze texts in ways that was not feasible twenty years ago. While the application of computing techniques against texts dates back to at least Father Busa’s concordance work in the 1960s, it has only been in the last decade that digital humanities has come into its own. The application of digital humanities to library work offers great opportunities for the profession. Their goals are similar and their tools are complementary. From my point of view, their combination is a marriage made in heaven.

A .zip file of the texts and scripts used to do the analysis is available for you to download and experiment with yourself. Enjoy.

AngelFund4Code4Lib

December 2nd, 2010

The second annual AngelFund4Code4Lib — a $1,500 stipend to attend Code4Lib 2011 — is now accepting applications.

These are difficult financial times, but we don’t want this to dissuade people from attending Code4Lib. [1] Consequently a few of us have gotten together, pooled our resources, and made AngelFund4Code4Lib available. Applying for the stipend is easy. In 500 words or less, write what you hope to learn at the conference and email it to angelfund4code4lib@infomotions.com. We will then evaluate the submissions and select the awardee. In exchange for the financial resources, and in keeping with the idea of giving back to the community, the awardee will be expected to write a travelogue describing their take-aways and post it to the Code4Lib mailing list.

The deadline for submission is 5 o’clock (Pacific Time), Thursday, December 17. The awardee will be announced no later than Friday, January 7.

Submit your application. We look forward to helping you out.

If you would like to become an “angel” too, then drop us a line. We’re open to possibilities.

P.S. Check out the additional Code4Lib scholarships. [2]

[1] Code4Lib 2011 – http://code4lib.org/conference/2011/
[2] addtional scholarships – http://bit.ly/dLGnnx

Eric Lease Morgan,
Michael J. Giarlo, and
Eric Hellman

Crowd sourcing the Great Books

November 6th, 2010

This posting describes how crowd sourcing techniques are being used to determine the “greatness” of the Great Books.

The Great Books of the Western World is a set of books authored by “dead white men” — Homer to Dostoevsky, Plato to Hegel, and Ptolemy to Darwin. [1] In 1952 each item in the set was selected because the set’s editors thought the selections significantly discussed any number of their 102 Great Ideas (art, cause, fate, government, judgement, law, medicine, physics, religion, slavery, truth, wisdom, etc.). By reading the books, comparing them with one another, and discussing them with fellow readers, a person was expected to foster their on-going liberal arts education. Think of it as “life long learning” for the 1950s.

I have devised and implemented a mathematical model for denoting the “greatness” of any book. The model is based on term frequency inverse document frequency (TFIDF). It is far from complete, nor has it been verified. In an effort to address the later, I have created the Great Books Survey. Specifically, I am asking people to vote on which books they consider greater. If the end result is similar to the output of my model, then the model may be said to represent reality.

charts The survey itself is an implementation of the Condorcet method. (“Thanks Andreas.”) First, I randomly select one of the Great Ideas. I then randomly select two of the Great Books. Finally, I ask the poll-taker to choose the “greater” of the two books based on the given Great Idea. For example, the randomly selected Great Idea may be war, and the randomly selected Great Books may be Shakespeare’s Hamlet and Plato’s Republic. I then ask, “Which is book is ‘greater’ in terms of war?” The answer is recorded and an additional question is generated. The survey is never-ending. After 100’s of thousands of votes are garnered I hope too learn which books are the greatest because they got the greatest number of votes.

Because the survey results are saved in an underlying database, it is trivial to produce immediate feedback. For example, I can instantly return which books have been voted greatest for the given idea, how the two given books compare to the given idea, a list of “your” greatest books, and a list of all books ordered by greatness. For a good time, I am also geo-locating voters’ IP addresses and placing them on a world map. (“C’mon Antartica. You’re not trying!”)

map The survey was originally announced on Tuesday, November 2 on the Code4Lib mailing list, Twitter, and Facebook. To date it has been answered 1,247 times by 125 people. Not nearly enough. So far, the top five books are:

  1. Augustine’s City Of God And Christian Doctrine
  2. Cervantes’s Don Quixote
  3. Shakespeare’s Midsummer Nights Dream
  4. Chaucers’s Canterbury Tales And Other Poems
  5. Goethe’s Faust

There are a number of challenging aspects regarding the validity of the survey. For example, many people feel unqualified to answer some of the randomly generated questions because they have not read the books. My suggestion is, “Answer the question anyway,” because given enough votes randomly answered questions will cancel themselves out. Second, the definition of “greatness” is ambiguous. It is not intended to be equated with popularity but rather the “imaginative or intellectual content” the book exemplifies. [2] Put in terms of a liberal arts education, greatness is the degree a book discusses, defines, describes, or alludes to the given idea more than the other. Third, people have suggested I keep track of how many times people answer with “I don’t know and/or neither”. This is a good idea, but I haven’t implemented it yet.

Please answer the survey 10 or more times. It will take you less than 60 seconds if you don’t think about it too hard and go with your gut reactions. There are no such things as wrong answers. Answer the survey about 100 times, and you will may get an idea of what types of “great books” interest you most.

Vote early. Vote often.

[1] Hutchins, Robert Maynard. 1952. Great books of the Western World. Chicago: Encyclopedia Britannica.

[2] Ibid. Volume 3, page 1220.

Great Books data set

November 6th, 2010

screenshot This posting makes the Great Books data set freely available.

As described previously, I want to answer the question, “How ‘great’ are the Great Books?” In this case I am essentially equating “greatness” with statistical relevance. Specifically, I am using the Great Books of the Western World’s list of “great ideas” as search terms and using them to query the Great Books to compute a numeric value for each idea based on term frequency inverse document frequency (TFIDF). I then sum each of the great idea values for a given book to come up with a total score — the “Great Ideas Coefficient”. The book with the largest Coefficient is then considered the “greatest” book. Along the way and just for fun, I have also kept track of the length of each book (in words) as well as two scores denoting each book’s reading level, and one score denoting each book’s readability.

The result is a canonical XML file named great-books.xml. This file, primarily intended for computer-to-computer transfer contains all the data outlined above. Since most data analysis applications (like databases, spreadsheets, or statistical packages) do not deal directly with XML, the data was transformed into a comma-separated value (CSV) file — great-books.csv. But even this file, a matrix of 220 rows and 104 columns, can be a bit unwieldily for the uninitiated. Consequently, the CSV file has been combined with a Javascript library (called DataTables) and embedded into an HTML for file general purpose use — great-books.htm.

The HTML file enables you to sort the matrix by column values. Shift click on columns to do sub-sorts. Limit the set by entering queries into the search box. For example:

  • sort by the last column (coefficient) and notice how Kant has written the “greatest” book
  • sort by the column labeled “love” and notice that Shakespeare has written seven (7) of the top ten (10) “greatest books” about love
  • sort by the column labeled “war” and notice that something authored by the United States is ranked #2 but also has very poor readability scores
  • sort by things like “angel” or “god”, then ask yourself, “Am I surprised at what I find?”

Even more interesting questions may be asked of the data set. For example, is their a correlation between greatness and readability? If a work has a high love score, then it is likely it will have a high (or low) score from one or more of the other columns? What is the greatness of the “typical” Great Book? Is this best represented as the average of the Great Ideas Coefficient or would it be better stated as the value of the mean of all the Great Ideas? In the case of the later, which books are greater than most, which books are typical, an which books are below typical? This sort of analysis, as well as the “kewl” Web-based implementation, is left up the the gentle reader.

Now ask yourself, “Can all of these sorts of techniques be applied to the principles and practices of librarianship, and if so, then how?”

ECDL 2010: A Travelogue

October 10th, 2010

This posting outlines my experiences at the European Conference on Digital Libraries (ECDL), September 7-9, 2010 in Glasgow (Scotland). From my perspective, many of the presentations were about information retrieval and metadata, and the advances in these fields felt incremental at best. This does not mean I did not learn anything, but it does re-enforce my belief that find is no longer the current problem to be solved.

University of Glasgow
vaulted ceiling
vaulted ceiling
Adam Smith
Adam Smith

Day #1 (Tuesday, September 7)

After the usual logistic introductions, the Conference was kicked off with a keynote address by Susan Dumais (Microsoft) entitled The Web changes everything: Understanding and supporting people in dynamic information environments. She began, “Change is the hallmark of digital libraries… digital libraries are dynamic”, and she wanted to talk about how to deal with this change. “Traditional search & browse interfaces only see a particular slice of digital libraries. An example includes the Wikipedia article about Bill Gates.” She enumerated at least two change metrics: the number of changes and the time between changes. She then went about taking snapshots of websites, measuring the changes, and ultimately dividing the observations into at least three “speeds”: fast, medium, and slow. In general the quickly changing sites (fast) had a hub & spoke architecture. The medium change speed represented popular sites such as mail and Web applications. The slowly changing sites were generally entry pages or sites accessed via search. “Search engines need to be aware of what people seek and what changes over time. Search engines need to take change into account.” She then demonstrated an Internet Explorer plug-in (DiffIE) which highlights the changes in a website over time. She advocated weighing search engine results based on observed changes in a website’s content.

Visualization was the theme of Sascha Tönnies‘s (L3S Research) Uncovering hidden qualities — Benefits of quality measures for automatic generated metadata. She described the use of tag clouds with changes in color and size. The experimented with “growbag” graphs which looked a lot of network graphs. She also explored the use of concentric circle diagrams (CCD), and based on her observations people identified with them very well. “In general, people liked the CDD graph the best because the radius intuitively represented a distance from the central idea.”

What appeared to me as the interpretation of metadata schemes through the use of triples, Panorea Gaitanou (Ionian University) described a way to query many cultural heritage institution collections in Query transformation in a CIDOC CRM Based cultural metadata integration environment. He called the approach MDL (Metadata Description Language). Lots of mapping and lots of XPath.

Michael Zarro (Drexel University) evaluated user comments written against the Library of Congress Flickr Commons Project in User-contributed descriptive metadata for libraries and cultural institutions. As a result, he was able to group the comments into at least four types. The first, personal/historical, were exemplified by things like, “I was there, and that was my grandfather’s house.” The second, links out, pointed to elaborations such as articles on Wikipedia. The third, corrections/translations, were amendments or clarifications. The last, links in, were pointers to Flickr groups. The second type of annotations, links out, were the most popular.

thistle
thistle
rose
rose
purple flower
purple flower

Developing services to support research data management and sharing was a panel discussion surrounding the topic of data curation. My take-away from Sara Jone‘s (DDC) remarks was, “There are no incentives for sharing research data”, and when given the opportunity for sharing data owners react by saying things like, “I’m giving my baby away… I don’t know the best practices… What are my roles and responsibilities?” Veerle Van den Eynden (United Kingdom Data Archive) outlined how she puts together infrastructure, policy, and support (such as workshops) to create successful data archives. “infrastructure + support + policy = data sharing” She enumerated time, attitudes and privacy/confidentiality as the bigger challenges. Robin Rice (EDINA) outlined services similar to Van den Eynden’s but was particularly interested in social science data and its re-use. There is a much longer tradition of sharing social science data and it is definitely not intended to be a dark archive. He enumerated a similar but different set of barriers to sharing: ownership, freedom of errors, fear of scooping, poor documentation, and lack of rewards. Rob Grim (Tilburg University) was the final panelist. He said, “We want to link publications with data sets as in Economists Online, and we want to provide a number of additional services against the data.” He described data sharing incentive, “I will only give you my data if you provide me with sets of services against it such as who is using it as well as where it is being cited.” Grim described the social issues surrounding data sharing as the most important. He compared & contrasted sharing with preservation, and re-use with archiving. “Not only is it important to have the data but it is also important to have the tools that created the data.”

From what I could gather, Claudio Gennaro (IST-CNR) in An Approach to content-based image retrieval based on the Lucene search engine library converted the binary content of images in to strings, indexed the strings with Lucene, and then used Lucene’s “find more like this one” features to… find more like this one.

Stina Westman (Aalto University) gave a paper called Evaluation constructs for visual video summaries. She said, “I want to summarize video and measure things like quality, continuity, and usefulness for users.” To do this she enumerated a number of summarizing types: 1) storyboard, 2) scene clips, 3) fast forward technologies, and 4) user-controlled fast forwarding. After measuring satisfaction, scene clips provided the best recognition but storyboards were more enjoyable. The clips and fast forward technologies were perceived as the best video surrogates. “Summaries’ usefulness are directly proportional to the effort to use them and the coverage of the summary… There is little difference between summary types… There is little correlation between the type of performance and satisfaction.”

Frank Shipman (Texas A&M University) in his Visual expression for organizing and accessing music collections in MusicWiz asked himself, “Can we provide access to music collections without explicit metadata; can we use implicit metadata instead?” The implementation of his investigation was an application called MusicWiz which is divided into a user interface and an inference engine. It consists of six modules: 1) artist, 2) metadata, 3) audio signal, 4) lyrics, 5) a workspace expression, and 6) similarity. In the end Shipman found “benefits and weaknesses to organizing personal music collections based on context-independent metadata… Participants found the visual expression facilitated their interpretation of mood… [but] the lack of traditional metadata made it more difficult to locate songs…”

distillers
distillers
barrels
barrels
whiskey
whiskey

Day #2 (Wednesday, September 8)

Liina Munari (European Commission) gave the second day’s keynote address called Digital libraries: European perspectives and initiatives. In it she presented a review of the Europeana digital library funding and future directions. My biggest take-aways was the following quote: “Orphan works are the 20th Century black hole.”

Stephan Strodl (Vienna University of Technology) described a system called Hoppla facilitating back-up and providing automatic migration services. Based on OAIS, it gets its input from email, a hard disk, or the Web. It provides data management access, preservation, and storage management. The system outsources the experience of others to implement these services. It seemingly offers suggestions on how to get the work done, but it does not actually do the back-ups. The title of his paper was Automating logical preservation for small institutions with Hoppla.

Alejandro Bia (Miguel Hernández University) in Estimating digitization costs in digital libraries using DiCoMo advocated making a single estimate for digitizing, and then making the estimate work. “Most of the cost in digitization is the human labor. Other things are known costs.” Based on past experience Bia graphed a curve of digitization costs and applied the curve to estimates. Factors that go into the curve includes: skill of the labor, familiarity with the material, complexity of the task, the desired quality of the resulting OCR, and the legibility of the original document. The whole process reminded me of Medieval scriptoriums.

city hall
city hall
lion
lion
stair case
stair case

Andrew McHugh (University of Glasgow) presented In pursuit of an expressive vocabulary for preserved New Media art. He is trying to preserve (conserve) New Media art by advocating the creation of medium-independent descriptions written by the artist so the art can be migrated forward. He enumerated a number of characteristics of the art to be described: functions, version, materials & dependencies, context, stakeholders, and properties.

In An Analysis of the evolving coverage of computer science sub-fields in the DBLP digital library Florian Reitz (University of Trier) presented an overview of the Digital Bibliography & Library Project (DBLP) — a repository of computer science conference presentations and journal articles. The (incomplete) collection was evaluated, and in short he saw the strengths and coverage of the collection change over time. In a phrase, he did a bit of traditional collection analysis against is non-traditional library.

A second presentation, Analysis of computer science communities based on DBLP, was then given on the topic of the DBLP, this time by Maria Biryukov (University of Luxembourg). She first tried to classify computer science conferences into sets of subfields in an effort to rank which conferences were “better”. One way this was done was through an analysis of who participated, the number of citations, the number of conference presentations, etc. She then tracked where a person presented and was able to see flows and patterns of publishing. Her conclusion — “Authors publish all over the place.”

In Citation graph based ranking in Invenio by Ludmila Marian (European Organization for Nuclear Research) the question was asked, “In a database of citations consisting of millions of documents, how can good precision be achieved if users only supply approximately 2-word queries?” The answer, she says, may lie in citation analysis. She weighed papers based on the number and locations of citations in a manner similar to Google PageRank, but in the end she realized the imperfection of the process since older publications seemed to unnaturally float to the top.

Day #3 (Thursday, September 9)

Sandra Toze (Dalhousie University) wanted to know how digital libraries support group work. In her Examining group work: Implications for the digital library as sharium she described the creation of an extensive lab for group work. Computers. Video cameras. Whiteboards. Etc. Students used her lab and worked in a manner she expected doing administrative tasks, communicating, problem solving, and the generation of artifacts. She noticed that the “sharium” was a valid environment for doing work, but she noticed that only individuals did information seeking while other tasks were done by the group as a whole. I found this later fact particularly interesting.

In an effort to build and maintain reading lists Gabriella Kazai (Microsoft) presented Architecture for a collaborative research environment based on reading list sharing. The heart of the presentation was a demonstration of ScholarLynk as well as Research Desktop — tools to implement “living lists” of links to knowledge sources. I went away wondering whether or not such tools save people time and increase knowledge.

The last presentation I attended was by George Lucchese (Texas A&M University) called CritSpace: A Workplace for critical engagement within cultural heritage digital libraries where he described a image processing tool intended to be used by humanities scholars. The tool does image processing, provides a workspace, and allows researchers to annotate their content.

Bothwell Castle
Bothwell Castle
Stirling Castle
Stirling Castle
Doune Castle
Doune Castle

Observations and summary

It has been just more than one month since I was in Glasgow attending the Conference, and much of the “glow” (all onomonopias intended) has worn off. The time spent was productive. For example, I was able to meet up with James McNulty (Open University) who spent time at Notre Dame with me. I attended eighteen presentations which were deemed innovative and scholarly by way of extensive review. I discussed digital library issues with numerous people and made an even greater number of new acquaintances. Throughout the process I did some very pleasant sight seeing both with conference attendees and on my own. At the same time I do not feel as if my knowledge of digital libraries was significantly increased. Yes, attendance was intellectually stimulating demonstrated by the number of to-do list items written in my notebook during the presentations, but the topics of discussion seemed worn out and not significant. Interesting but only exemplifying subtle changes from previous research.

My attendance was also a mission. More specifically, I wanted to compare & contrast the work going on here with the work being done at the 2010 Digital Humanities conference. In the end, I believe the two groups are not working together but rather, as one attendee put it, “talking past one another.” Both groups — ECDL and Digital Humanities — have something in common — libraries and librarianship. But on one side are computer scientists, and on the other side are humanists. The first want to implement algorithms and apply them to many processes. If such a thing gets out of hand, then the result is akin to a person owning a hammer and everything looking like a nail. The second group is ultimately interested in describing the human condition and addressing questions about values. This second process is exceedingly difficult, if not impossible, to measure. Consequently any sort of evaluation is left up to a great deal of subjectivity. Many people would think these two processes are contradictory and/or conflicting. In my opinion, they are anything but in conflict. Rather, these two processes are complementary. One fills the deficiencies of the other. One is more systematic where the other is more judgmental. One relates to us as people, and the other attempts to make observations devoid of human messiness. In reality, despite the existence of these “two cultures”, I see the work of the scientists and the work of the humanists to be equally necessary in order for me to make sense of the world around me. It is nice to know libraries and librarianship seem to represent a middle ground in this regard. Not ironically, that is one of most important reasons I explicitly chose my profession. I desired to practice both art and science — arscience. It is just too bad that these two groups do not work more closely together. There seems to be too much desire for specialization instead. (Sigh.)

Because of a conflict in acronyms, the ECDL conference has all but been renamed to Theory and Practice of Digital Libraries (TPDL), and next year’s meeting will take place in Berlin. Despite the fact that this was my third for fourth time attending ECDL, and I doubt I will attend next year. I do not think information retrieval and metadata standards are as important as they have been. Don’t get me wrong. I didn’t say they were unimportant, just not as important as they used to be. Consequently, I think I will be spending more of my time investigating the digital humanities where content has already been found and described, and is now being evaluated and put to use.

River Clyde
River Clyde
River Teith
River Teith

Dan Marmion

October 3rd, 2010

Dan Marmion and ISDADan Marmion recruited and hired me to work at the University of Notre Dame during the Summer of 2001. The immediate goal was to implement a “database-driven website”, which I did with the help of the Digital Access and Information Architecture Department staff and MyLibrary.

About eighteen months after I started working at the University I felt settled in. It was at that time when I realized I had accomplished all the goals I had previously set out for myself. I had a family. I had stuff. I had the sort of job I had always aspired to have in a place where I aspired to have it. I woke up one morning and asked myself, “Now what?”

After a few months of cogitation I articulated a new goal: to raise a happy, healthy, well-educated child. (I only have one.) By now my daughter is almost eighteen years old. She is responsible and socially well-adjusted. She is stands up straight and tall. She has a pretty smile. By this time next year I sincerely believe she will be going to college with her tuition paid for by Notre Dame. Many of the things that have been accomplished in the past nine years and many of the things to come are results from Dan hiring me.

Dan Marmion died Wednesday, September 22, 2010 from brain cancer. “Dan, thank you for the means and the opportunities. You are sorely missed.”

Great Books data dictionary

September 24th, 2010

This is a sort of Great Books data dictionary in that it describes the structure and content of two data files containing information about the Great Books of the Western World.

The data set is manifested in two files. The canonical file is great-books.xml. This XML file consists of a root element (great-books) and many sub-elements (books). The meat of the file resides in these sub-elements. Specifically, with the exception of the id attribute, all the book attributes enumerate integers denoting calculated values. The attributes words, fog, and kincaid denote the length of the work, two grade levels, and a readability score, respectively. The balance of the attributes are “great ideas” as calculated through a variation Term Frequency Inverse Document Frequency (TFIDF) cumulating in a value called the Great Ideas Coefficient. Finally, each book element includes sub-elements denoting who wrote the work (author), the work’s name (title), the location of the file was used as the basis of the calculations (local_url), and the location of the original text (original_url).

The second file (great-books.csv) is a derivative of the first file. This comma-separated file is intended to be read by something like R or Excel for more direct manipulation. It includes all the information from great-books.xml with the exception of the author, title, and URLs.

Given either one of these two files the developer or statistician is expected to evaluate or re-purpose the results of the calculations. For example, given one or the other of these files the following questions could be answered:

  • What is the “greatest” book and who wrote it?
  • What is the average “great book” score?
  • Are there clusters of great ideas?
  • Which authors wrote extensively on what great ideas?
  • Is there a correlation between greatness and length and readability?

The really adventurous developer will convert the XML file into JSON and then create a cool (or “kewl”) Web interface allowing anybody with a browser to do their own evaluation and presentation. This is an exercise left up to the reader.

Twitter, Facebook, Delicious, and Alex

September 18th, 2010

I spent time last evening and this afternoon integrating Twitter, Facebook, and Delicious into the my Alex Catalogue. The process was (almost) trivial:

  1. create Twitter, Facebook, and Delicious accounts
  2. select and configure the Twitter button I desired to use
  3. acquire the Delicious javascript for bookmarking
  4. place the results of Steps #1 and #2 into my HTML
  5. rebuild my pages
  6. install and configure the Twitter application for Facebook

Because of this process I am able to “tweet” from Alex, its search results, any of the etexts in the collection, as well as any results from the use of the concordances. These tweets then get echoed to Facebook.

(I tried to link directly to Facebook using their Like Button, but the process was cumbersome. Iframes. Weird, Facebook-specific Javascript. Pulling too much content from the header of my pages. Considering the Twitter application for Facebook, the whole thing was not worth the trouble.)

I find it challenging to write meaningful 140 character comments on the Alex Catalogue, especially since the URLs take up such a large number of the characters. Still, I hope to regularly find interesting things in the collection and share them with the wider audience. To see the fruits of my labors to date, see my Twitter feed — http://twitter.com/ericleasemorgan.

Only time will tell whether or not this “social networking” thing proves to be beneficial to my library — all puns intended.

Where in the world are windmills, my man Friday, and love?

September 12th, 2010

This posting describes how a Perl module named Lingua::Concordance allows the developer to illustrate where in the continum of a text words or phrases appear and how often.

Windmills, my man Friday, and love

When it comes to Western literature and windmills, we often think of Don Quiote. When it comes to “my man Friday” we think of Robinson Crusoe. And when it comes to love we may very well think of Romeo and Juliet. But I ask myself, “How often do these words and phrases appear in the texts, and where?” Using digital humanities computing techniques I can literally illustrate the answers to these questions.

Lingua::Concordance

Lingua::Concordance is a Perl module (available locally and via CPAN) implementing a simple key word in context (KWIC) index. Given a text and a query as input, a concordance will return a list of all the snippets containing the query along with a few words on either side. Such a tool enables a person to see how their query is used in a literary work.

Given the fact that a literary work can be measured in words, and given then fact that the number of times a particular word or phrase can be counted in a text, it is possible to illustrate the locations of the words and phrases using a bar chart. One axis represents a percentage of the text, and the other axis represents the number of times the words or phrases occur in that percentage. Such graphing techniques are increasingly called visualization — a new spin on the old adage “A picture is worth a thousand words.”

In a script named concordance.pl I answered such questions. Specifically, I used it to figure out where in Don Quiote windmills are mentiond. As you can see below they are mentioned only 14 times in the entire novel, and the vast majority of the time they exist in the first 10% of the book.

  $ ./concordance.pl ./don.txt 'windmill'
  Snippets from ./don.txt containing windmill:
	* DREAMT-OF ADVENTURE OF THE WINDMILLS, WITH OTHER OCCURRENCES WORTHY TO
	* d over by the sails of the windmill, Sancho tossed in the blanket, the
	* thing is ignoble; the very windmills are the ugliest and shabbiest of 
	* liest and shabbiest of the windmill kind. To anyone who knew the count
	* ers say it was that of the windmills; but what I have ascertained on t
	* DREAMT-OF ADVENTURE OF THE WINDMILLS, WITH OTHER OCCURRENCES WORTHY TO
	* e in sight of thirty forty windmills that there are on plain, and as s
	* e there are not giants but windmills, and what seem to be their arms a
	* t most certainly they were windmills and not giants he was going to at
	*  about, for they were only windmills? and no one could have made any m
	* his will be worse than the windmills," said Sancho. "Look, senor; thos
	* ar by the adventure of the windmills that your worship took to be Bria
	*  was seen when he said the windmills were giants, and the monks' mules
	*  with which the one of the windmills, and the awful one of the fulling
  
  A graph illustrating in what percentage of ./don.txt windmill is located:
	 10 (11) #############################
	 20 ( 0) 
	 30 ( 0) 
	 40 ( 0) 
	 50 ( 0) 
	 60 ( 2) #####
	 70 ( 1) ##
	 80 ( 0) 
	 90 ( 0) 
	100 ( 0)

If windmills are mentioned so few times, then why do they play so prominently in people’s minds when they think of Don Quiote? To what degree have people read Don Quiote in its entirity? Are windmills as persistent a theme throughout the book as many people may think?

What about “my man Friday”? Where does he occur in Robinson Crusoe? Using the concordance features of the Alex Catalogue of Electronic Texts we can see that a search for the word Friday returns 185 snippets. Mapping those snippets to percentages of the text results in the following bar chart:

bar chart
Friday in Robinson Crusoe

Obviously the word Friday appears towards the end of the novel, and as anybody who has read the novel knows, it is a long time until Robinson Crusoe actually gets stranded on the island and meets “my man Friday”. A concordance helps people understand this fact.

What about love in Romeo and Juliet? How often does the word occur and where? Again, a search for the word love returns quite a number of snippets (175 to be exact), and they are distributed throughout the text as illustrated below:

bar chart
love in Romeo and Juliet

“Maybe love is a constant theme of this particular play,” I state sarcastically, and “Is there less love later in the play?”

Digital humanities and librarianship

Given the current environment, where full text literature abounds, digital humanities and librarianship are a match made in heaven. Our library “discovery systems” are essencially indexes. They enable people to find data and information in our collections. Yet find is not an end in itself. In fact, it is only an activity at the very beginning of the learning process. Once content is found it is then read in an attempt at understanding. Counting words and phrases, placing them in the context of an entire work or corpus, and illustrating the result is one way this understanding can be accomplished more quickly. Remember, “Save the time of the reader.”

Integrating digital humanities computing techniques, like concordances, into library “discovery systems” represent a growth opportunity for the library profession. If we don’t do this on our own, then somebody else will, and we will end up paying money for the service. Climb the learning curve now, or pay exorbitant fees later. The choice is ours.

Ngrams, concordances, and librarianship

August 30th, 2010

This posting describes how the extraction of ngrams and the implementation of concordances are integrated into the Alex Catalogue of Electronic Texts. Given the increasing availability of full-text content in libraries, the techniques described here could easily be incorporated into traditional library “discovery systems” and/or catalogs, if and only if the library profession were to shift its definition of what it means to practice librarianship.

Lingua::EN::Bigram

During the past couple of weeks, in fits of creativity, one of the things I spent some of my time on was a Perl module named Lingua::EN::Bigram. At version 0.03, it now supports not only bigrams, trigrams, and quadgrams (two-, three-, and four-word phrases, respectively), but also ngrams — multi-word phrases of an arbitrary length.

Given this enhanced functionality, and through the use of a script called ngrams.pl, I learned that the 10 most frequently used 5-word phrases and the number of times they occur in Henry David Thoreau’s Walden seem to surround spacial references:

  • a quarter of a mile (6)
  • i have no doubt that (6)
  • as if it were a (6)
  • the other side of the (5)
  • the surface of the earth (4)
  • the greater part of the (4)
  • in the midst of a (4)
  • in the middle of the (4)
  • in the course of the (3)
  • two acres and a half (3)

Whereas the same process applied to Thoreau’s A Week on the Concord and Merrimack Rivers returns lengths and references to flowing water, mostly:

  • a quarter of a mile (8)
  • on the bank of the (7)
  • the surface of the water (6)
  • the middle of the stream (6)
  • as if it were the (5)
  • as if it were a (4)
  • is for the most part (4)
  • for the most part we (4)
  • the mouth of this river (4)
  • in the middle of the (4)

While not always as clear cut as the examples outlined above, the extraction and counting of ngrams usually supports the process of “distant reading” — a phrase coined by Franco Moretti in Graphs, Maps, Trees: Abstract Models for Literary History (2007) to denote the counting, graphing, and mapping of literary texts. With so much emphasis on reading in libraries, I ask myself, “Ought the extraction of ngrams be applied to library applications?”

Concordances

Concordances are literary tools used to evaluate texts. Dating back to as early as the 12th or 13th centuries, they were first used to study religious materials. Concordances take many forms, but they usually list all the words in a text, the number of times each occurs, and most importantly, places where each word within the context of its surrounding text — a key-word in context (KWIC) index. Done by hand, the creation of concordances is tedious and time consuming, and therefore very expensive. Computers make the work of creating a concordance almost trivial.

Each of the full text items in the Alex Catalogue of Electronic Texts (close to 14,000 of them) is accompanied with a concordance. They support the following functions:

  • list of all the words in the text starting with a given letter and the number of times each occurs
  • list the most frequently used words in the text and the number of times each occurs
  • list the most frequently used ngrams in a text and the number of times each occurs
  • display individual items from the lists above in a KWIC format
  • enable the student or scholar to search the text for arbitrary words or phrases (regular expressions) and have them displayed in a KWIC format

Such functionality allows people to answer many questions quickly and easily, such as:

  • Does Mark Twain’s Adventures of Huckleberry Finn contain many words beginning with the letter z, and if so, how many times and in what context?
  • To what extent does Aristotle’s Metaphysics use the word “good”, and maybe just as importantly, how is the word “evil” used in the same context?
  • In Jack London’s Call of the Wild the phrase “man in the red sweater” is one of the more frequently used. Who was this man and what role does he play in the story?
  • Compared to Shakespeare, to what extent does Plato discuss love, and how do the authors’ expositions differ?

The counting of words, the enumeration of ngrams, and the use of concordances are not intended to short-circuit traditional literary studies. Instead, they are intended to supplement and enhance the process. Traditional literary investigations, while deep and nuanced, are not scalable. A person is not able to read, compare & contrast, and then comprehend the essence of all of Shakespeare, all of Plato, and all of Charles Dickens through “close reading”. An individual simply does not have enough time. In the words of Gregory Crane, “What do you do with a million books?” Distant reading, akin to the proceses outlined above, make it easier to compare & contrast large corpora, discover patterns, and illustrate trends. Moreover, such processes are reproducible, less prone to subjective interpretation, and not limited to any particular domain. The counting, graphing, and mapping of literary texts makes a lot of sense.

The home page for the concordances is complete with a number of sample texts. Alternatively, you can search the Alex Catalogue and find an item on your own.

Library “discovery systems” and/or catalogs

The amount of full text content available to libraries has never been greater than it is today. Millions of books have been collectively digitized through Project Gutenberg, the Open Content Alliance, and the Google Books Project. There are thousands of open access journals with thousands upon thousands of freely available scholarly articles. There are an ever-growing number of institutional repositories both subject-based as well as institutional-based. These too are rich with full text content. None of this even considers the myriad of grey literature sites like blogs and mailing list archives.

Library “discovery systems” and/or catalogs are designed to organize and provide access to the materials outlined above, but they need to do more. First of all, the majority of the profession’s acquisitions processes assume collections need to be paid for. With the increasing availability of truly free content on the Web, greater emphasis needs to be placed on harvesting content as opposed to purchasing or licensing it. Libraries are expected to build collections designed to stand the test of time. Brokering access to content through licensing agreements — one of the current trends in librarianship — will only last as long as the money lasts. Licensing content makes libraries look like cost centers and negates the definition of “collections”.

Second, library “discovery systems” and/or catalogs assume an environment of sacristy. They assume the amount of accessible, relevant data and information needed by students, teachers, and researchers is relatively small. Thus, a great deal of the profession’s efforts go into enabling people to find their particular needle in one particular haystack. In reality, current indexing technology makes the process of finding relavent materials trivial, almost intelligent. Implemented correctly, indexers return more content than most people need, and consequently they continue to drink from the proverbial fire hose.

Let’s turn these lemons into lemonade. Let’s redirect some of the time and money spent on purchasing licenses towards the creation of full text collections by systematic harvesting. Let’s figure out how to apply “distant reading” techniques to the resulting collections thus making them, literally, more useful and more understandable. These redirections represent a subtle change in the current direction of librarianship. At the same time, they retain the core principles of the profession, namely: collection, organization, preservation, and dissemination. The result of such a shift will result in an increased expertise on our part, the ability to better control our own destiny, and contribute to the overall advancement of our profession.

What can we do to make these things come to fruition?

Lingua::EN::Bigram (version 0.03)

August 23rd, 2010

I uploaded version 0.03 of Lingua::EN::Bigram to CPAN today, and it now supports not just bigrams, trigrams, quadgrams, but ngrams — an arbitrary phrase length.

In order to test it out, I quickly gathered together some of my more recent essays, concatonated them together, and applied Lingua::EN::Bigram against the result. Below is a list of the top 10 most common bigrams, trigrams, and quadgrams:

  bigrams                 trigrams                  quadgrams
  52  great ideas         36  the number of         25  the number of times
  43  open source         36  open source software  13  the total number of
  38  source software     32  as well as            10  at the same time
  29  great books         28  number of times       10  number of words in
  24  digital humanities  27  the use of            10  when it comes to
  23  good man            25  the great books       10  total number of documents
  22  full text           23  a set of              10  open source software is
  22  search results      20  eric lease morgan      9  number of times a
  20  lease morgan        20  a number of            9  as well as the
  20  eric lease          19  total number of        9  through the use of

Not surprising since I have been writing about the Great Books, digital humanities, indexing, and open source software. Re-affirming.

Lingu::EN::Bigram is available locally as well as from CPAN.

Lingua::EN::Bigram (version 0.02)

August 22nd, 2010

I have written and uploaded to CPAN version 0.02 of my Perl module Lingua::EN::Bigram. From the README file:

This module is designed to: 1) pull out all of the two-, three-, and four-word phrases in a given text, and 2) list these phrases according to their frequency. Using this module is it possible to create lists of the most common phrases in a text as well as order them by their probable occurrence, thus implying significance. This process is useful for the purposes of textual analysis and “distant reading”.

Using this module I wrote a script called n-grams.pl. Feed it a plain text file, and it will return the top 10 most significant bigrams (as calculated by T-Score) as well as the top 10 most common trigrams and quadgrams. For example, here is the output of n-grams.pl when Henry David Thoreau’s Walden is input:

  Bi-grams (T-Score, count, bigram)
  4.54348783312048  22  one day  
  4.35133234596553  19  new england  
  3.705427371426    14  walden pond  
  3.66575742655033  14  one another  
  3.57857056272537  13  many years  
  3.55592136768501  13  every day  
  3.46339791276118  12  fair haven  
  3.46101939872834  12  years ago  
  3.38519781332654  12  every man  
  3.29818626191729  11  let us  
  
  Tri-grams (count, trigram)
  41  in the woods
  40  i did not
  28  i do not
  28  of the pond
  27  as well as
  27  it is a
  26  part of the
  25  that it was
  25  as if it
  25  out of the
  
  Quad-grams (count, quadgram)
  20  for the most part
  16  from time to time
  15  as if it were
  14  in the midst of
  11  at the same time
   9  the surface of the
   9  i think that i
   8  in the middle of
   8  worth the while to
   7  as if they were

The whole thing gets more interesting when you compare that output to another of Thoreau’s works — A Week on the Concord and Merrimack Rivers:

  Bi-grams (T-Score, count, bi-gram)
  4.62683939320543  22  one another  
  4.57637831535376  21  new england  
  4.08356124174142  17  let us  
  3.86858364314677  15  new hampshire  
  3.43311180449584  12  one hundred  
  3.31196701774012  11  common sense  
  3.25007069543896  11  can never  
  3.15955504269006  10  years ago  
  3.14821552996352  10  human life  
  3.13793008615654  10  told us  
  
  Tri-grams (count, tri-gram)
  41  as well as
  38  of the river
  34  it is a
  30  there is a
  30  one of the
  28  it is the
  27  as if it
  26  it is not
  26  if it were
  24  it was a
  
  Quad-grams (count, quad-gram)
  21  for the most part
  20  as if it were
  17  from time to time
   9  on the bank of
   8  the bank of the
   8  in the midst of
   8  a quarter of a
   8  the middle of the
   8  quarter of a mile
   7  at the same time

Ask yourself, “Are their similarities between the outputs? How about differences? Do you notice any patterns or anomalies? What sorts of new discoveries might be made if n-grams.pl where applied to the entire corpus of Thoreau’s works? How might the output be different if a second author’s works were introduced?” Such questions are the core of digital humanities research. With the increasing availability of full text content in library collections, such are the questions the library profession can help answer if the profession were to expand it’s definition of “service”.

Search and retrieve are not the pressing problems to solved. People can find more data and information than they know what to do with. Instead, the pressing problems surround use and understanding. Lingua::EN::Bigram is an example of how these newer and more pressing problems can be addressed. The module is available for downloading (locally as well as from CPAN). Also for your perusal is n-grams.pl.

Cool URIs

August 22nd, 2010

I have started implementing “cool” URIs against the Alex Catalogue of Electronic Texts.

As outlined in Cool URIs for the Semantic Web, “The best resource identifiers… are designed with simplicity, stability and manageability in mind…” To that end I have taken to creating generic URIs redirecting user-agents to URLs based on content negotiation — 303 URI forwarding. These URIs also provide a means to request specific types of pages. The shapes of these URIs follow, where “key” is a foreign key in my underlying (MyLibrary) database:

  • http://infomotions.com/etexts/id/key – generic; redirection based on content negotiation
  • http://infomotions.com/etexts/page/key – HTML; the text itself
  • http://infomotions.com/etexts/data/key – RDF; data about the text
  • http://infomotions.com/etexts/concordance/key – concordance; a means for textual analysis

For example, the following URIs return different versions/interfaces of Henry David Thoreau’s Walden:

This whole thing makes my life easier. No need to remember complicated URLs. All I have to remember is the shape of my URI and the foreign key. Through the process this also makes the URLs easier to type, shorten, distribute, and display.

The downside of this implementation is the need for an always-on intermediary application doing the actual work. The application, implemented as mod_perl module, is called Apache2::Alex::Dereference and available for your perusal. Another downside is the need for better, more robust RDF, but that’s for later.

rsync, a really cool utility

August 18th, 2010

Without direct physical access to my co-located host, backing up and preserving the Infomotions’ 150 GB of website is challenging, but through the use of rsync things are a whole lot easier. rsync is a really cool utility, and thanks go to Francis Kayiwa who recommended it to me in the first place. “Thank you!”

Here is my rather brain-dead back-up utility:

# rsync.sh - brain-dead backup of wilson

# change directories to the local store
cd /Users/eric/wilson

# get rid of any weird Mac OS X filenames
find ./ -name '.DS_Store' -exec rm -rf {} \;

# do the work for one remote file system...
rsync --exclude-from=/Users/eric/etc/rsync-exclude.txt \
    -avz wilson:/disk01/ \
    ./disk01/

# ...and then another
rsync --exclude-from=/Users/eric/etc/rsync-exclude.txt \
    -avz wilson:/home/eric/ \
    ./home/eric/

After I run this code my local Apple Macintosh Time Capsule automatically copies my content to yet a third spinning disk. I feel much better about my data now that I have started using rsync.

WiLSWorld, 2010

August 6th, 2010

WiLS logoI had the recent honor, privilege, and pleasure of attending WiLSWorld (July 21-22, 2010 in Madison, Wisconsin), and this posting outlines my experiences there. In a sentence, I was pleased so see the increasing understanding of “discovery” interfaces defined as indexes as opposed to databases, and it is now my hope we — as a profession — can move beyond search & find towards use & understand.

Wednesday, July 21

With an audience of about 150 librarians of all types from across Wisconsin, the conference began with a keynote speech by Tim Spalding (LibraryThing) entitled “Social cataloging and the future”. The heart of his presentation was a thing he called the Ladder of Social Cataloging which has six “rungs”: 1) personal cataloging, 2) sharing, 3) implicit social cataloging, 4) social networking, 5) explicitly social cataloging, and 6) collaboration. Much of what followed were demonstrations of how each of these things are manifested in LibraryThing. There were a number meaty quotes sprinkled throughout the talk:

…We [LibraryThing] are probably not the biggest book club anymore… Reviews are less about buying books and more about sharing minds… Tagging is not about something for everybody else, but rather about something for yourself… LibraryThing was about my attempt to discuss the things I wanted to discuss in graduate school… We have “flash mobs” cataloging peoples’ books such as the collections of Thomas Jefferson, John Adams, Ernest Hemingway, etc… Traditional subject headings are not manifested in degrees; all LCSH are equally valid… Library data can be combined but separate from patron data.

I was duly impressed with this presentation. It really brought home the power of crowd sourcing and how it can be harnessed in a library setting. Very nice.

Peter Gilbert (Lawrence University) then gave a presentation called “Resource discovery: I know it when I see it”. In his words, “The current problem to solve is to remove all of the solos: books, articles, digitized content, guides to subjects, etc.” The solution, in his opinion, is to implement “discovery systems” similar to Blacklight, eXtensible Catalog, Primo & Primo Central, Summon, VUFind, etc. I couldn’t have said it better myself. He gave a brief overview of each system.

Ken Varnum (University of Michigan Library) described a website redesign process in “Opening what’s closed: Using open source tools to tear down vendor silos”. As he said, “The problem we tried to solve in our website redesign was the overwhelming number of branch library websites. All different. Almost schizophrenic.” The solution grew out of a different premise for websites. “Information not location.” He went on to describe a rather typical redesign process complete with focus group interviews, usability studies, and advisory groups, but there were a couple of very interesting tidbits. First, inserting the names and faces of librarian in search results has proved popular with students. Second, I admired the “participatory design” process he employed. Print a design. Allow patrons to use pencils to add, remove, or comment on aspects of the layout. I also think the addition of a professional graphic designer helped their process.

I then attended Peter Gorman‘s (University of Wisconsin-Madison) “Migration of digital content to Fedora”. Gorman had the desire to amalgamate institutional content, books, multimedia and finding aids (EAD files) into a single application… yet another “discovery system” description. His solution was to store content into Fedora, index the content, and provide services against the index. Again, a presenter after my own heart. Better than anyone had done previously, Gorman described Fedora’s content model complete with identifiers (keys), a sets of properties (relationships, audit trails, etc.), and a data streams (JPEG, XML, TIFF, etc.). His description was clear and very easy to digest. The highlight was a description of Fedora “behaviors”. These are things people are intended to do with data streams. Examples include enlarging a thumbnail image or transforming a online finding aid into something designed for printing. These “behaviors” are very much akin — if not exactly like — the “services against texts” I have been advocating for a few years.

Thursday, July 22

The next day I gave a presentation called “Electronic texts and the evolving definition of librarianship”. This was an extended version of my presentation at ALA given a few weeks ago. To paraphrase, “As we move from databases towards indexes to facilitate search, the problems surrounding find are not as acute. Given the increasing availability of digitized full text content, library systems have the opportunity to employ ‘digital humanities computing techniques’ against collections and enable people to do ‘distant reading’.” I then demonstrated how the simple counting of words and phrases, the use of concordances, and the application of TFIDF can facilitate rudimentary comparing & contrasting of corpora. Giving this presentation was an enjoyable experience because it provided me the chance to verbalize and demonstrate much of my current “great books” research.

Later in the morning helped facilitate a discussion on the process a library could go through to implement the ideas outlined in my presentation, but the vast majority of people attended the presentation by Keith Mountin (Apple Computer, Inc.) called “The iPad and its application in libraries”.

Conclusion

Madison was just as nice as I remember. Youthful. Liberal. Progressive. Thanks go to Deb Shapiro and Mark Beatty. They invited me to sit with them on the capitol lawn and listen to the local orchestra play Beatles music. The whole thing was very refreshing.

The trip back from the conference was a hellacious experience in air travel, but it did give me the chance to have an extended chat with Tim Spalding in the airport. We discussed statistics and statistical measures that can be applied to content we are generating. Many of the things he is doing with metadata I may be able to do with full text. The converse is true as well. Moreover, by combining our datasets we may find that the sum is greater than the parts — all puns intended. Both Tim and I agreed this is something we should both work towards. Afterwards I ate macaroni & cheese with a soft pretzel and a beer. It seemed apropos for Wisconsin.

This was my second or third time attending WiLSWorld. Like the previous meetings, the good folks at WiLS — specifically Tom Zilner, Mark Beatty, and Shirley Schenning — put together a conference providing librarians from across Wisconsin with a set of relatively inexpensive professional development opportunities. Timely presentations. Plenty of time for informal discussions. All in a setting conducive to getting away and thinking a bit outside the box. “Thank you.”

Digital Humanities 2010: A Travelogue

July 25th, 2010

I was fortunate enough to be able to attend a conference called Digital Humanities 2010 (London, England) between July 4th and 10th. This posting documents my experiences and take-aways. In a sentence, the conference provided a set of much needed intellectual stimulation and challenges as well as validated the soundness of my current research surrounding the Great Books.

lunch castle castle

Pre-conference activities

All day Monday, July 5, I participated in a workshop called Text mining in the digital humanities facilitated by Marco Büchler, et al. of the University of Leipzig. A definition of “e-humanities” was given, “The application of computer science to do qualitative evaluation of texts without the use of things like TEI.” I learned that graphing texts illustrates concepts quickly — “A picture is worth a thousand words.” Also, I learned I should consider creating co-occurrence graphs — pictures illustrating what words co-occur with a given word. Finally, according to the Law of Least Effort, the strongest content words in a text are usually the ones that do not occur most frequently, nor the ones occurring the least, but rather the words occurring somewhere in between. A useful quote includes, “Text mining allows one to search even without knowing any search terms.” Much of this workshop’s content came from the eAQUA Project.

On Tuesday I attended the first half of a THATCamp led by Dan Cohen (George Mason University) where I learned THATCamps are expected to be: 1) fun, 2) productive, and 3) collegial. The whole thing came off as a “bar camp” for scholarly conferences. As a part of the ‘Camp I elected to participate in the Developer’s Challenge and submitted an entry called “How ‘great’ is this article?“. My hack compared texts from the English Women’s Journal to the Great Books Coefficient in order to determine “greatness”. My entry did not win. Instead the prize went to Patrick Juola with honorable mentions going to Loretta Auvil, Marco Büchler, and Thomas Eckart.

Wednesday morning I learned more about text mining in a workshop called Introduction to text analysis using JiTR and Voyeur led by Stéfan Sinclair (McMaster University) and Geoffrey Rockwell (University of Alberta). The purpose of the workshop was “to learn how to integrate text analysis into a scholar’s/researcher’s workflow.” More specifically, we learned how to use a tool called Voyeur, an evolution of the TAPoR. The “kewlest” thing I learned was the definition of word density, (U / W) 1000, where U is the total number of unique words in a text and W is the total number of words in a text. The closer the result is to 1000 the richer and more dense a text is. In general, denser documents are more difficult to read. (For a good time, I wrote density.pl — a program to compute density given an arbitrary plain text file.)

In keeping with the broad definition of humanities, I was “seduced” in the afternoon by listening to recordings of a website called CHARM (Center for History and Analysis of Recorded Music). The presentation described and presented digitized classical music from the very beginnings of recorded music. All apropos since the BBC was located just across the street from King’s College where the conference took place. When this was over we retired to the deck for tea and cake. There I learned the significant recording time differences between 10″ and 12″ 78/rpm records. Like many mediums, the recording artist needed to make accommodations accordingly.

me abbey abbey

Plenty of presentations

The conference officially began Wednesday evening and ended Saturday afternoon. According to my notes, I attended at many as eighteen sessions. (Wow!?) Listed below are summaries of most of the ones I attended:

  • Charles Henry (Council on Library and Information Resources) and Hold up a mirror – In this keynote presentation Henry compared & contrasted manifestations (oral, written, and digital) of Homer, Beowulf, and a 9-volume set of religious ceremonies compiled in the 18th century. He then asked the question, “How can machines be used to capture the interior of the working mind?” Or, in my own words, “How can computers be used to explore the human condition?” The digital versions of the items listed above were used as example answers, and a purpose of the conference was to address this question in other ways. He said, “There are many types of performance, preservation, and interpretation.”
  • Patrick Juola (Duquesne University) and Distant reading and mapping genre space via conjecture-based distance measures – Juola began by answering the question, “What do you do with a million books?”, and enumerated a number of things: 1) search, 2) summarize, 3) sample, and 4) visualize. These sorts of proceses against texts is increasingly called “distant reading” and is contrasted with the more traditional “close reading”. He then went on to describe his “Conjecturator” — a system where assertions are randomly generated and then evaluated. He demonstrated this technique against a set of Victorian novels. His presentation was not dissimilar to the presentation he gave at digital humanities conference in Chicago the previous year.
  • Jan Rybicki (Pedagogical University) and Deeper delta across genres and language: Do we really need the most frequent words? – In short Rybicki said, “Doing simple frequency counts [to do authorship analysis] does not work very well for all languages, and we are evaluating ‘deeper deltas'” — an allusion to the work for J.F. Burrows and D.L. Hoover. Specifically, using a “moving window” of stop words he looked for similarities in authorship between a number of texts and believed his technique has proved to be more or less successful.
  • David Holms (College of New Jersey) and The Diary of a public man: A Case study in traditional and non-traditional author attribution – Soon after the civil war a book called The Diary Of A Public Man was written by an anonymous author. Using stylometric techniques, Holms asserts the work really was written as a diary and was authored by William Hurlbert.
  • David Hoover (New York University) and Teasing out authorship and style with t-tests and zeta – Hoover used T-tests and Zeta tests to validated whether or not a particular author finished a particular novel from the 1800s. Using these techniques he was successfully able to illustrate writing styles and how they changed dramatically between one chapter in the book and another chapter. He asserted that such analysis would have been extremely difficult through rudimentary casual reading.
  • Martin Holmes (University of Victoria) and Using the universal similarity metric to map correspondences between witnesses – Holmes described how he was comparing the similarity between texts through the use of a compression algorithm. Compress texts. Compare their resulting lengths. The closer to lengths the greater the similarity. The process works for a variety of file types, languages, and when there there is no syntactical knowledge.
  • Dirk Roorda (Data Archiving and Networked Services) and The Ecology of longevity: The Relevance of evolutionary theory for digital preservation – Roorda drew parallels between biology and preservation. For example, biological systems use and retain biological characteristics. Preservation systems re-use and thus preserve content. Biological systems make copies and evolve. Preservation can be about migrating formats forward thus creating different forms. Biological systems employ sexual selections. “Look how attractive I am.” Repositories or digital items displaying “seals of approval” function similarly. Finally, he went on to describe how these principles could be integrated in a preservation system where fees are charged for storing content and providing access to it. He emphasized such systems would not necessarily be designed to handle intellectual property rights.
  • Lewis Ulman (Ohio State University) & Melanie Schlosser (Ohio State University) and The Specimen case and the garden: Preserving complex digital objects, sustaining digital projects – Ulman and Schlosser described a dichotomy manifesting itself in digital libraries. On one hand there is a practical need for digital library systems to be similar between each other because “boutique” systems are very expensive to curate and maintain. At the same time specialized digital library applications are needed because they represent the frontiers of research. How to accomodate both, that was their question. “No one group (librarians, information technologist, faculty) will be able to do preservation alone. They need to work together. Specifically, they need to connect, support, and curate.”
  • George Buchanan (City University) and Digital libraries of scholarly editions – Similar to Ulman/Schlosse above, Buchanan said, “It is difficult to provide library services against scholarly editions because each edition is just too much different from the next to create a [single] system.” He advocated the Greenstone digital library system.

book ice cream beer

  • Joe Raben (Queens College of the City University of New York) and Humanities computing in an age of social change – In this presentation, given after being honored with the community’s Busa Award, Raben first outlined the history of the digital humanities. It included the work done by Father Busa who collaborated with IBM in the 1960s to create a concordance against some of Thomas Aquinas‘s work. It included a description of a few seminal meetings and the formulation of the Computing in the Humanities journal. He alluded to “machine readable texts” — a term which is no longer in vogue but reminded me of “machine readable cataloging” (MARC) and how the library profession has not moved on. He advocated for a humanities wiki where ideas and objects could be shared. It sounded a lot like the arts-humanities.net website. He discussed the good work of a Dante project hosted at Princeton University, and I was dismayed because Notre Dame’s significant collection of Dante materials has not played a role in this particular digital library. A humanist through and through, he said, “Computers are increasingly controlling our lives and the humanities have not effected how we live in the same way.” To this I say, computers represent close trends compared to the more engrained values of the human condition. The former are quick to change, the later change oh so very slowly yet they are more pervasive. Compared to computer technology, I believe the humanists have had more long-lasting effects on the human condition.
  • Lynne Siemens (University of Victoria) and A Tale of two cities: Implications of the similarities in collaborative approaches within the digital libraries and digital humanities communities – Siemans reported on the results of survey in an effort to determine how and why digital librarians and digital humanists collaborate. “There are cultural differences between librarians and academics, but teams [including both] are necessary. The solution is to assume the differences rather than the similarities. Everybody brings something to the team.”
  • Fenella France (Library of Congress) and Challenges of linking digital heritage scientific data with scholarly research: From navigation to politics – France described some of the digital scanning processes of the Library of Congress, and some the consequences. For example, their technique allowed archivists to discover how Thomas Jefferson wrote, crossed out, and then replaced the word “subjects” with “citizens” in a draft of the Declaration of Independence. A couple of interesting quotes included, “We get into the optical archeology of the documents”, and “Digitization is access, not preservation.”
  • Joshua Sternfeld (National Endowment for the Humanities) and Thinking archivally: Search and metadata as building blocks for a new digital historiography – Sternfeld advocated for different sets of digital library evaluation. “There is a need for more types of reviews against digital resource materials. We need a method for doing: selection, search, and reliability… The idea of provenance — the order of document creation — needs to be implemented in the digital realm.”
  • Wendell Piez (Mulberry Technologies, Inc.) and Towards hermeneutic markup: An Architectural outline – Hermeneutic markup are annotations against a text that are purely about interpretation. “We don’t really have the ability to do hermeneutic markup… Existing schemas are fine, but every once in a while exceptions need to be made and such things break the standard.” Numerous times Piez alluded to the “overlap problem” — the inability to demarcate something crossing the essentially strict hierarchal nature of XML elements. Textual highlighting is a good example. Piez gave a few examples of how the overlap problem might be resolved and how hermeneutic markup may be achieved.
  • Jane Hunter (University of Queensland) and The Open Annotation collaboration: A Data model to support sharing and interoperability of scholarly annotations – Working with a number of other researchers, Hunter said, “The problem is that there is an extraordinarily wide variety of tools, lack of consistency, no standards, and no sharable interoperability when it comes to Web-based annotation.” Their goal is to create a data model to enable such functionality. While the model is not complete, it is being based on RDF, SANE, and OATS. See www.openannotation.org.
  • Susan Brown (University of Alberta and University of Guelph) and How do you visualize a million links? – Brown described a number of ways she is exploring visualization techniques. Examples included link graphs, tag clouds, bread board searches, cityscapes, and something based on “six degrees of separation”.
  • Lewis Lancaster (University of California, Berkeley) and From text to image to analysis: Visualization of Chinese Buddhist canon – Lancaster has been doing research against a (huge) set of Korean glyphs for quite a number of years. Just like other writing techniques, the glyphs change over time. Through the use digital humanities computing techniques, he has been able to discover much more quickly patterns and bigrams that he was not able to discover previously. “We must present our ideas as images because language is too complex and takes too much time to ingest.”

church gate alley

Take-aways

In the spirit of British fast food, I have a number of take-aways. First and foremost, I learned that my current digital humanities research into the Great Books is right on target. It asks questions of the human condition and tries to answer them through the use of computing techniques. This alone was the worth the total cost of my attendance.

Second, as a relative outsider to the community, I percieved a pervasive us versus them mentality being described. Us digital humanists and those traditional humanists. Us digital humanists and those computer programmers and systems administrators. Us digital humanists and those librarians and archivists. Us digital humanists and those academic bureaucrats. If you consider yourself a digital humanist, then please don’t take this observation the wrong way. I believe communities inherently do this as a matter of fact. It is a process used to define one’s self. The heart of much of this particular differenciation seems to be yet another example of C.P. Snow‘s The Two Cultures. As a humanist myself, I identify with the perception. I think the processes of art and science complement each other, not contradict nor conflict. A balance of both are needed in order to adequantly create a cosmos out of the apparent chaos of our existance — a concept I call arscience.

Third, I had ample opportunities to enjoy myself as a tourist. The day I arrived I played frisbee disc golf with a few “cool dudes” at Lloyd Park in Croydon. On the Monday I went to the National Theater and saw Welcome to Thebes — a depressing tragedy where everybody dies. On the Tuesday I took in Windsor Castle. Another day I carried my Culver Citizen newspaper to have its photograph taken in front of Big Ben. Throughout my time there I experienced interesting food, a myriad of languages & cultures, and the almost overwhelming size of London. Embarassingly, I had forgotten how large the city really is.

Finally, I actually enjoyed reading the formally published conference abstracts — all three pounds and 400 pages of it. It was thorough, complete, and even included an author index. More importantly, I discovered more than a few quotes supporting an idea for library systems that I have been calling “services against texts”:

The challenge is to provide the researcher with a means to perceiving or specifying subsets of data, extracting the relevent information, building the nodes and edges, and then providing the means to navigate the vast number of nodes and edges. (Susan Brown in “How do you visualize a million links” on page 106)

However, current DL [digital library] systems lack critical features: they have too simple a model of documents, and lack scholarly apparatus. (George Buchanan in “Digital libraries of scholarly editions” on page 108.)

This approach takes us to the what F. Moretti (2005) has termed ‘distant reading,’ a method that stresses summarizing large bodies of text rather than focusing on a few texts in detail. (Ian Gregory in “GIS, texts and images: New approaches to landscape appreciation in the Lake District” on page 159).

And the best quote is:

In smart digital libraries, a text should not only be an object but a service: not a static entity but an interactive method. The text should be computationally exploitable so that it can be sampled and used, not simply reproduced in its entirety… the reformulation of the dictionary not as an object, but a service. (Toma Tasovac in “Reimaging the dictionary, or why lexicography needs digital humanities” on page 254)

In conclusion, I feel blessed with the ability to attended the conference. I learned a lot, and I will recommend it to any librarian or humanist.

How “great” is this article?

July 9th, 2010

During Digital Humanities 2010 I participated in the THATCamp London Developers’ Challenge and tried to answer the question, “How ‘great’ is this article?” This posting outlines the functionality of my submission, links to a screen capture demonstrating it, and provides access to the source code.

screen captureGiven any text file — say an article from the English Women’s Journal — my submission tries to answer the question, “How ‘great’ is this article?” It does this by:

  1. returning the most common words in a text
  2. returning the most common bigrams in a text
  3. calculating a few readability scores
  4. comparing the texts to a standardized set of “great ideas”
  5. supporting a concordance for browsing

Functions #1, #2, #3, and #5 are relatively straight-forward and well-understood. Function #4 needs some explanation.

In the 1960’s a set of books was published called the Great Books. The set is based on a set of 102 “great ideas” (such as art, love, honor, truth, justice, wisdom, science, etc.). By summing the TFIDF scores of each of these ideas for each of the books, a “great ideas coefficient” can be computed. Through this process we find that Shakespeare wrote seven of the top ten books when it comes to love. Kant wrote the “greatest book”. The American State’s Articles of Confederation ranks the highest when it come to war. This “coefficient” can then be used as a standard — an index — for comparing other documents. This is exactly what this program does. (See the screen capture for a demonstration.)

The program can be improved a number of ways:

  1. it could be Web-based
  2. it could process non-text files
  3. it could graphically illustrate a text’s “greatness”
  4. it could hyperlink returned words directly to the concordance

Thanks to Gerhard Brey and the folks of the Nineteenth Century Serials Editions for providing the data. Very interesting.

ALA 2010

June 30th, 2010

ALA 2010This is the briefest of travelogues describing my experience at the 2010 ALA Annual Meeting in Washington (DC).

Pat Lawton and I gave a presentation at the White House Four Points Hotel on the “Catholic Portal“. Essentially it was a status report. We shared the podium with Jon Miller (University of Southern California) who described the International Mission Photography Archive — an extensive collection of photographs taken by missionaries from many denominations.

I then took the opportunity to visit my mother in Pennsylvania, but the significant point is the way I got out of town. I had lost my maps, and my iPad came to the rescue. The Google Maps application was very, very useful.

On Monday I shared a podium with John Blyberg (Darien Library) and Tim Spalding (LibraryThing) as a part of a Next-Generation Library Catalog Special Interest Group presentation. John provided an overview of the latest and greatest features of SOPAC. He emphasized a lot of user-centered design. Tim described library content and services as not (really) being a part of the Web. In many ways I agree with him. I outlined how a few digital humanities computing techniques could be incorporated into library collections and services in a presentation I called “The Next Next-Generation Library Catalog“. That afternoon I participated in a VUFind users-group meeting, and I learned that I am pretty much on target in regards to the features of this “discovery system”. Afterwards a number of us from the Catholic Research Resources Alliance (CRRA) listened to folks from Crivella West describe their vision of librarianship. The presentation was very interesting because they described how they have taken many collections of content and mined them for answers to questions. This is digital humanities to the extreme. Their software — the Knowledge Kiosk — is being used to analyze the content of John Henry Newman at the Newman Institute.

Tuesday morning was spent more with the CRRA. We ratified next year’s strategic plan. In the afternoon I visited a few of my friends at the Library of Congress (LOC). There I learned a bit how the LOC may be storing and archiving Twitter feeds. Interesting.

Text mining against NGC4Lib

June 25th, 2010

I “own” a mailing list called NCG4Lib. It’s purpose is to provide a forum for the discussion of all things “next generation library catalog”. As of this writing, there are about 2,000 subscribers.

Lately I have been asking myself, “What sorts of things get discussed on the list and who participates in the discussion?” I thought I’d try to answer this question with a bit of text mining. This analysis only covers the current year to date, 2010.

Author names

Even though there are as many as 2,000 subscribers, only a tiny few actually post comments. The following pie and line charts illustrate the point without naming any names. As you can see, eleven (11) people contribute 50% of the postings.

posters
11 people post 50% of the messages

The lie chart illustrates the same point differently; a few people post a lot. We definitely have a long tail going on here.

posters
They definitely represent a long tail

Subject lines

The most frequently used individual subject line words more or less reflect traditional library cataloging practices. MARC. MODS. Cataloging. OCLC. But also notice how the word “impasse” is included. This may reflect something about the list.

subject words
The subject words look “traditional”

I’m not quite sure what to make of the most commonly used subject word bigrams.

subject bigrams
‘Don’t know what to make of these bigrams

Body words

The most frequently used individual words in the body of the postings tell a nice story. Library. Information. Data. HTTP. But notice what is not there — books. I also don’t see things like collections, acquisitions, public, services, nor value or evaluation. Hmm…

body words
These tell a nice story

The most frequently used bigrams in the body of the messages tell an even more interesting story because the they are dominated by the names of people and things.

body bigrams
Names of people and things

The phrases “information services” and “technical services” do not necessarily fit my description. Using a concordance to see how these words were being used, I discovered they were overwhelmingly a part of one or more persons’ email signatures or job descriptions. Not what I was hoping for. (Sigh.)

Conclusions

Based on these observations, as well as my personal experience, I believe the NGC4Lib mailing list needs more balance. It needs more balance in a couple of ways:

  1. There are too few people who post the majority of the content. The opinions of eleven people do not, IMHO, represent the ideas and beliefs of more than 2,000. I am hoping these few people understand this and will moderate themselves accordingly.
  2. The discussion is too much focused, IMHO, on traditional library cataloging. There is so much more to the catalog than metadata. We need to be asking questions about what it contains, how that stuff is selected and how it gets in there, what the stuff is used for, and how all of this fits into the broader, worldwide information environment. We need to be discussing issues of collection and dissemination, not just organization. Put another way, I wish I had not used the word “catalog” in the name of the list because I think the word brings along too many connotations and preconceived ideas.

As the owner of the list, what will I do? Frankly, I don’t know. Your thoughts and comments are welcome.

The Next Next-Generation Library Catalog

June 24th, 2010

With the advent of the Internet and wide-scale availability of full-text content, people are overwhelmed with the amount of accessible data and information. Library catalogs can only go so far when it comes to delimiting what is relevant and what is not. Even when the most exact searches return 100’s of hits what is a person to do? Services against texts — digital humanities computing techniques — represent a possible answer. Whether the content is represented by novels, works of literature, or scholarly journal articles the methods of the digital humanities can provide ways to compare & contrast, analyze, and make more useful any type of content. This essay elaborates on these ideas and describes how they can be integrated into the “next, next-generation library catalog”.

(Because this essay is the foundation for a presentation at the 2010 ALA Annual Meeting, this presentation is also available as a one-page handout designed for printing as well as bloated set of slides.)

Find is not the problem

Find is not the problem to be solved. At most, find is a means to an end and not the end itself. Instead, the problem to solve surrounds use. The profession needs to implement automated ways to make it easier users do things against content.

The library profession spends an inordinate amount of time and effort creating catalogs — essentially inventory lists of things a library owns (or licenses). The profession then puts a layer on top of this inventory list — complete with authority lists, controlled vocabularies, and ever-cryptic administrative data — to facilitate discovery. When poorly implemented, this discovery layer is seen by the library user as an impediment to their real goal. Read a book or article. Verify a fact. Learn a procedure. Compare & contrast one idea with another idea. Etc.

In just the past few years the library profession has learned that indexers (as opposed to databases) are the tools to facilitate find. This is true for two reasons. First, indexers reduce the need for users to know how the underlying data is structured. Second, indexers employ statistical analysis to rank it’s output by relevance. Databases are great for creating and maintaining content. Indexers are great for search. Both are needed in equal measures in order to implement the sort of information retrieval systems people have come to expect. For example, many of the profession’s current crop of “discovery” systems (VUFind, Blacklight, Summon, Primo, etc.) all use an open source indexer called Lucene to drive search.

This being the case, we can more or less call the problem of find solved. True, software is never done, and things can always be improved, but improvements in the realm of search will only be incremental.

Instead of focusing on find, the profession needs to focus on the next steps in the process. After a person does a search and gets back a list of results, what do they want to do? First, they will want to peruse the items in the list. After identifying items of interest, they will want to acquire them. Once the selected items are in hand users may want to print, but at the very least they will want to read. During the course of this reading the user may be doing any number of things. Ranking. Reviewing. Annotating. Summarizing. Evaluating. Looking for a specific fact. Extracting the essence of the author’s message. Comparing & contrasting the text to other texts. Looking for sets of themes. Tracing ideas both inside and outside the texts. In other words, find and acquire are just a means to greater ends. Find and acquire are library goals, not the goals of users.

People want to perform actions against the content they acquire. They want to use the content. They want to do stuff with it. By expanding our definition of “information literacy” to include things beyond metadata and bibliography, and by combining it with the power of computers, librarianship can further “save the time of the reader” and thus remain relevant in the current information environment. Focusing on the use and evaluation of information represents a growth opportunity for librarianship.

It starts with counting

The availability of full text content in the form of plain text files combined with the power of computing empowers one to do statistical analysis against corpora. Put another way, computers are great at counting words, and once sets of words are counted there are many things one can do with the results, such as but not limited to:

  • measuring length
  • measuring readability, “greatness”, or any other index
  • measuring frequency of unigrams, n-grams, parts-of-speech, etc.
  • charting & graphing analysis (word clouds, scatter plots, histograms, etc.)
  • analyzing measurements and looking for patterns
  • drawing conclusions and making hypotheses

For example, suppose you did the perfect search and identified all of the works of Plato, Aristotle, and Shakespeare. Then, if you had the full text, you could compute a simple table such as Table 1.

Author Works Words Average Grade Flesch
Plato 25 1,162,46 46,499 12-15 54
Aristotle 19 950,078 50,004 13-17 50
Shakespeare 36 856,594 23,794 7-10 72

The table lists who wrote how many works. It lists the number of words in each set of works and the average number of words per work. Finally, based on things like sentence length, it estimates grade and reading levels for the works. Given such information, a library “catalog” could help the patron could answer questions such as:

  • Which author has the most works?
  • Which author has the shortest works?
  • Which author is the most verbose?
  • Is the author of most works also the author who is the most verbose?
  • In general, which set of works requires the higher grade level?
  • Does the estimated grade/reading level of each authors’ work coincide with one’s expectations?
  • Are there any authors whose works are more or less similar in reading level?

Given the full text, a trivial program can then be written to count the number of words existing in a corpus as well as the number of times each word occurs, as shown in Table 2.

Plato Aristotle Shakespeare
will one thou
one will will
socrates must thy
may also shall
good things lord
said man thee
man may sir
say animals king
true thing good
shall two now
like time come
can can well
must another enter
another part love
men first let
now either hath
also like man
things good like
first case one
let nature upon
nature motion know
many since say
state others make
knowledge now may
two way yet

Table 2, sans a set of stop words, lists the most frequently used words in the complete works of Plato, Aristotle, and Shakespeare. The patron can then ask and answer questions like:

  • Are there words in one column that appear frequently in all columns?
  • Are there words that appear in only one column?
  • Are the rankings of the words similar between columns?
  • To what degree are the words in each column a part of larger groups such as: nouns, verbs, adjectives, etc.?
  • Are there many synonyms or antonyms shared inside or between the columns?

Notice how the words “one”, “good” and “man” appear in all three columns. Does that represent some sort of shared quality between the works?

If one word contains some meaning, then do two words contain twice as much meaning? Here is a list of the most common two-word phrases (bigrams) in each author corpus, Table 3.

Plato Aristotle Shakespeare
let us one another king henry
one another something else thou art
young socrates let uses thou hast
just now takes place king richard
first place one thing mark antony
every one without qualification prince henry
like manner middle term let us
every man first figure king lear
quite true b belongs thou shalt
two kinds take place duke vincentio
human life essential nature dost thou
one thing every one sir toby
will make practical wisdom art thou
human nature will belong henry v
human mind general rule richard iii
quite right anything else toby belch
modern times one might scene ii
young men first principle act iv
can hardly good man iv scene
will never two things exeunt king
will tell two kinds don pedro
dare say first place mistress quickly
will say like manner act iii
false opinion one kind thou dost
one else scientific knowledge sir john

Notice how the names of people appear frequently in Shakespeare’s works, but very few names appear in the lists of Plato and Aristotle. Notice how the word “thou” appears a lot in Shakespeare’s works. Ask yourself the meaning of the word “thou”, and decide whether or not to update the stop word list. Notice how the common phrases of Plato and Aristotle are akin to ideas, not tangible things. Examples include: human nature, practical wisdom, first principle, false opinion, etc. Is there a pattern here?

If “a picture is worth a thousand words”, then there are about six thousand words represented by Figures 1 through 6.

Words used by Plato
words used by Plato
Phrases used by Plato
phrases used by Plato
Words used by Aristotle
words used by Aristotle
Phrases used by Aristotle
phrases used by Aristotle
Words used by Shakespeare
words used by Shakespeare
Phrases used by Shakespeare
phrases used by Shakespeare

Word clouds — “tag clouds” — are an increasingly popular way to illustrate the frequency of words or phrases in a corpus. Because a few of the phrases in a couple of the corpuses were considered outliers, phrases such as “let us”, “one another”, and “something else” are not depicted.

Even without the use of statistics, it appears the use of the phrase “good man” by each author might be interestingly compared & contrasted. A concordance is an excellent tool for such a purpose, and below are a few of the more meaty uses of “good man” by each author.

List 1 – “good man” as used by Plato
  ngth or mere cleverness. To the good man, education is of all things the most pr
   Nothing evil can happen to the good man either in life or death, and his own de
  but one reply: 'The rule of one good man is better than the rule of all the rest
   SOCRATES: A just and pious and good man is the friend of the gods; is he not? P
  ry wise man who happens to be a good man is more than human (daimonion) both in 
List 2 – “good man” as used by Aristotle
  ons that shame is felt, and the good man will never voluntarily do bad actions. 
  reatest of goods. Therefore the good man should be a lover of self (for he will 
  hat is best for itself, and the good man obeys his reason. It is true of the goo
  theme If, as I said before, the good man has a right to rule because he is bette
  d prove that in some states the good man and the good citizen are the same, and 
List 3 – “good man” as used by Shakespeare
  r to that. SHYLOCK Antonio is a good man. BASSANIO Have you heard any imputation
  p out, the rest I'll whistle. A good man's fortune may grow out at heels: Give y
  t it, Thou canst not hit it, my good man. BOYET An I cannot, cannot, cannot, An 
  hy, look where he comes; and my good man too: he's as far from jealousy as I am 
   mean, that married her, alack, good man! And therefore banish'd -- is a creatur

What sorts of judgements might the patron be able to make based on the snippets listed above? Are Plato, Aristotle, and Shakespeare all defining the meaning of a “good man”? If so, then what are some of the definitions? Are there qualitative similarities and/or differences between the definitions?

Sometimes being as blunt as asking a direct question, like “What is a man?”, can be useful. Lists 4 through 6 try to answer it.

List 4 – “man is” as used by Plato
  stice, he is met by the fact that man is a social being, and he tries to harmoni
  ption of Not-being to difference. Man is a rational animal, and is not -- as man
  ss them. Or, as others have said: Man is man because he has the gift of speech; 
  wise man who happens to be a good man is more than human (daimonion) both in lif
  ied with the Protagorean saying, 'Man is the measure of all things;' and of this
List 5 – “man is” as used by Aristotle
  ronounced by the judgement 'every man is unjust', the same must needs hold good 
  ts are formed from a residue that man is the most naked in body of all animals a
  ated piece at draughts. Now, that man is more of a political animal than bees or
  hese vices later. The magnificent man is like an artist; for he can see what is 
  lement in the essential nature of man is knowledge; the apprehension of animal a
List 6 – “man is” as used by Shakespeare
   what I have said against it; for man is a giddy thing, and this is my conclusio
   of man to say what dream it was: man is but an ass, if he go about to expound t
  e a raven for a dove? The will of man is by his reason sway'd; And reason says y
  n you: let me ask you a question. Man is enemy to virginity; how may we barricad
  er, let us dine and never fret: A man is master of his liberty: Time is their ma

In the 1950s Mortimer Adler and a set of colleagues created a set of works they called The Great Books of the Western World. This 80-volume set included all the works of Plato, Aristotle, and Shakespeare as well as some of the works of Augustine, Aquinas, Milton, Kepler, Galileo, Newton, Melville, Kant, James, and Frued. Prior to the set’s creation, Adler and colleagues enumerated 102 “greatest ideas” including concepts such as: angel, art, beauty, honor, justice, science, truth, wisdom, war, etc. Each book in the series was selected for inclusion by the committee because of the way the books elaborated on the meaning of the “great ideas”.

Given the full text of each of the Great Books as well as a set of keywords (the “great ideas”), it is relatively simple to calculate a relevancy ranking score for each item in a corpus. Love is one of the “great ideas”, and it just so happens it is used most significantly by Shakespeare compared to the use of the other authors in the set. If Shakespeare has the highest “love quotient”, then what does Shakespeare have to say about love? List 7 is a brute force answer to such a question.

List 7 – “love is” as used by Shakespeare
  y attempted? Love is a familiar; Love is a devil: there is no evil angel but Lov
  er. VALENTINE Why? SPEED Because Love is blind. O, that you had mine eyes; or yo
   that. DUKE This very night; for Love is like a child, That longs for every thin
  n can express how much. ROSALIND Love is merely a madness, and, I tell you, dese
  of true minds Admit impediments. Love is not love Which alters when it alteratio

Do these definitions coincide with expectations? Maybe further reading is necessary.

Digital humanities, library science, and “catalogs”

The previous section is just about the most gentle introduction to digital humanities computing possible, but can also be an introduction to a new breed of library science and library catalogs.

It began by assuming the existence of full text content in plain text form — an increasingly reasonable assumption. After denoting a subset of content, it compared & contrasted the sizes and reading levels of the content. By counting individual words and phrases, patterns were discovered in the texts and a particular idea was loosely followed — specifically, the definition of a good man. Finally, the works of a particular author were compared to the works of a larger whole to learn how the author defined a particular “great idea”.

The fundamental tools used in this analysis were a set of rudimentary Perl modules: Lingua::EN::Fathom for calculating the total number of words in a document as well as a document’s reading level, Lingua::EN::Bigram for listing the most frequently occurring words and phrases, and Lingua::Concordance for listing sentence snippets. The Perl programs built on top of these modules are relatively short and include: fathom.pl, words.pl, bigrams.pl and concordance.pl. (If you really wanted to download the full text versions of Plato, Aristotle, and Shakespeare‘s works used in this analysis.) While the programs themselves are really toys, the potential they represent are not. It would not be too difficult to integrate their functionality into a library “catalog”. Assume the existence of significant amount of full text content in a library collection. Do a search against the collection. Create a subset of content. Click a few buttons to implement statistical analysis against the result. Enable the user to “browse” the content and follow a line of thought.

The process outlined in the previous section is not intended to replace rigorous reading, but rather to supplement it. It enables a person to identify trends quickly and easily. It enables a person to read at “Web scale”. Again, find is not the problem to be solved. People can find more information than they require. Instead, people need to use and analyze the content they find. This content can be anything from novels to textbooks, scholarly journal articles to blog postings, data sets to collections of images, etc. The process outlined above is an example of services against texts, a way to “Save the time of the reader” and empower them to make better and more informed decisions. The fundamental processes of librarianship (collection, preservation, organization, and dissemination) need to be expanded to fit the current digital environment. The services described above are examples of how processes can be expanded.

The next “next generation library catalog” is not about find, instead it is about use. Integrating digital humanities computing techniques into library collections and services is just one example of how this can be done.

Measuring the Great Books

June 15th, 2010

This posting describes how I am assigning quantitative characteristics to texts in an effort to answer the question, “How ‘great’ are the Great Books?” In the end I make a plea for library science.

Background

With the advent of copious amounts of freely available plain text on the ‘Net comes the ability of “read” entire corpora with a computer and apply statistical processes against the result. In an effort to explore the feasibility of this idea, I am spending time answering the question, “How ‘great’ are the Great Books?

More specifically, want to assign quantitative characteristics to each of the “books” in the Great Books set, look for patterns in the result, and see whether or not I can draw any conclusions about the corpus. If such processes are proven effective, then the same processes may be applicable to other corpora such as collections of scholarly journal articles, blog postings, mailing list archives, etc. If I get this far, then I hope to integrate these processes into traditional library collections and services in an effort to support their continued relevancy.

On my mark. Get set. Go.

Assigning quantitative characteristics to texts

The Great Books set posits 102 “great ideas” — basic, foundational themes running through the heart of Western civilization. Each of the books in the set were selected for inclusion by the way they expressed the essence of these great ideas. The ideas are grand and ambiguous. They include words such as angel, art, beauty, courage, desire, eternity, god, government, honor, idea, physics, religion, science, space, time, wisdom, etc. (See Appendix B of “How ‘great’ are the Great Books?” for the complete list.)

In a previous posting, “Great Ideas Coefficient“, I outlined the measure I propose to use to determine the books’ “greatness” — essentially a sum of all TFIDF (term frequency / inverse document frequency) scores as calculated against the list of great ideas. TFIDF is defined as:

( c / t ) * log( d / f )

where:

  • c = number of times a given word appears in a document
  • t = total number of words in a document
  • d = total number of documents in a corpus
  • f = total number of documents containing a given word

Thus, the problem boils down to determining the values for c, t, d, and f for a given great idea, 2) summing the resulting TFIDF scores, 3) saving the results, and 4) repeating the process for each book in the corpus. Here, more exactly, is how I am initially doing such a thing:

  1. Build corpus – In a previous posting, “Collecting the Great Books“, I described how I first collected 223 of the roughly 250 Great Books.
  2. Index corpus – The process used to calculate the TFIDF values of c and t are trivial because any number of computer programs do such a thing quickly and readily. In our case, the value of d is a constant — 223. On the other hand, trivial methods for determining the number of documents containing a given word (f) are not scalable as the size of a corpus increases. Because an index is essentially a list of words combined with the pointers to where the words can be found, an index proves to be a useful tool for determining the value of f. Index a corpus. Search the index for a word. Get back the number of hits and use it as the value for f. Lucene is currently the gold standard when it comes to open source indexers. Solr — an enhanced and Web Services-based interface to Lucene — is the indexer used in this process. The structure of the local index is rudimentary: id, author, title, URL, and full text. Each of the metadata values are pulled out of a previously created index file — great-books.xml — while the full text is read from the file system. The whole lot is then stuffed into Solr. A program called index.pl does this work. Another program called search.pl was created simply for testing the validity of the index.
  3. Count words and determine readability – A Perl module called Lingua::EN::Fathom does a nice job of counting the number of words in a file, thus providing me with a value for t. Along the way it also calculates a number of “readability” scores — values used to determine the necessary education level of a person needed to understand a given text. While I had “opened the patient” I figured it would be a good idea to take note of this information. Given the length of a book as well as its readability scores, I enable myself to answer questions such as, “Are longer books more difficult to read?” Later on, given my Great Ideas Coefficient, I will be able to answer questions such as “Is the length of a book a determining factor in ‘greatness’?” or “Are ‘great’ books more difficult to read?”
  4. Calculate TFIDF – This is the fuzziest and most difficult part of the measurement process. Using Lingua::EN::Fathom again I find all of the unique words in a document, stem them with Lingua::Stem::Snowball, and calculate the number of times each stem occurs. This gives me a value for c. I then loop through each great idea, stem them, and search the index for the stem thus returning a value for f. For each idea I now have values for c, t, d, and f enabling me to calculate TFIDF — ( c / t ) * log( d / f ).
  5. Calculate the Great Ideas Coefficient – This is trivial. Keep a running sum of all the great idea TFIDF scores.
  6. Go to Step #4 – Repeat this process for each of the 102 great ideas.
  7. Save – After all the various scores (number of words, readability scores, TFIDF scores, and Great Ideas Coefficient) have been calculated I save each to my pseudo database file called great-ideas.xml. Each is stored as an attribute associated with a book’s unique identifier. Later I will use the contents of this file as the basis of my statistical analysis.
  8. Go to Step #3 – Repeat this process for each book in the corpus, and in this case 223 times.

Of course I didn’t do all of this by hand, and the program I wrote to do the work is called measure.pl.

The result is my pseudo database file — great-books.xml. This is my data set. It keeps track all of my information in a human-readable, application- and operating system-independent manner. Very nice. If there is only one file you download from this blog posting, then it should be this file. Using it you will be able to create your own corpus and do your own analysis.

The process outlined above is far from perfect. First, there are a few false negatives. For example, the great idea “universe” returned a TFIDF value of zero (0) for every document. Obviously is is incorrect, and I think the error has something to do with the stemming and/or indexing subprocesses. Second, the word “being”, as calculated by TFIDF, is by far and away the “greatest” idea. I believe this is true because the word “being” is… being counted as both a noun as well as a verb. This points to a different problem — the ambiguity of the English language. While all of these issues will knowingly skew the final results, I do not think they negate the possibility of meaningful statistical investigation. At the same time it will be necessary to refine the measurement process to reduce the number of “errors”.

Measurment, the humanities, and library science

Measurement is one of the fundamental qualities of science. The work of Archimedes is the prototypical example. Kepler and Galileo took the process to another level. Newton brought it to full flower. Since Newton the use of measurement — the assignment of mathematical values — applied against observations of the natural world and human interactions have given rise to the physical and social sciences. Unlike studies in the humanities, science is repeatable and independently verifiable. It is objective. Such is not a value judgment, merely a statement of fact. While the sciences seem cold, hard, and dry, the humanities are subjective, appeal to our spirit, give us a sense of purpose, and tend to synthesis our experiences into a meaningful whole. Both of the scientific and humanistic thinking processes are necessary for us to make sense of the world around us. I call these combined processes “arscience“.

The library profession could benefit from the greater application of measurement. In my opinion, too much of the profession’s day-to-day as well as strategic decisions are based on antidotal evidence and gut feelings. Instead of basing our actions on data, actions are based on tradition. “This is the way we have always done it.” This is medieval, and consequently, change comes very slowly. I sincerely believe libraries are not going away any time soon, but I do think the profession will remain relevant longer if librarians were to do two things: 1) truly exploit the use of computers, and 2) base a greater number of their decisions on data — measurment — as opposed to opinion. Let’s call this library science.

Collecting the Great Books

June 13th, 2010

In an effort to answer the question, “How ‘great’ are the Great Books?“, I need to mirror the full texts of the Great Books. This posting describes the initial process I am using to do such a thing, but the imporant thing to note is that this process is more about librarianship than it is about software.

Background

The Great Books is/was a 60-volume set of content intended to further a person’s liberal arts education. About 250 “books” in all, it consists of works by Homer, Aristotle, Augustine, Chaucer, Cervantes, Locke, Gibbon, Goethe, Marx, James, Freud, etc. There are a few places on the ‘Net where the complete list of authors/titles can be read. One such place is a previous blog posting of mine. My goal is to use digital humanities computing techniques to statistically describe the works and use these descriptions to supplement a person’s understanding of the texts. I then hope to apply these same techniques to other corpora. To accomplish this goal I first need to acquire full text versions of the Great Books. This posting describes how I am initially going about it.

Mirroring and caching the Great Books

All of the books of the Great Books were written by “old dead white men”. It is safe to assume the texts have been translated into a myriad of languages, including English, and it is safe to assume the majority exist in the public domain. Moreover, with the advent of the Web and various digitizing projects, it is safe to assume quality information gets copied forward and will be available for downloading. All of this has proven to be true. Through the use of Google and a relatively small number of repositories (Project Gutenberg, Alex Catalogue of Electronic Texts, Internet Classics Archive, Christian Classics Ethereal Library, Internet Archive, etc.), I have been able to locate and mirror 223 of the roughly 250 Great Books. Here’s how:

  1. Bookmark texts – Trawl the Web for the Great Books and use Delicious to bookmark links to plain text versions translated into English. Firefox combined with the Delicious extension have proven to be very helpful in this regard. My bookmarks should be located at http://delicious.com/ericmorgan/gb.
  2. Save and edit bookmarks file – Delicious gives you the option to save your bookmarks file locally. The result is a bogus HTML file intended to be imported into Web browsers. It contains the metadata used to describe your bookmarks such as title, notes, and URLs. After exporting my bookmarks to the local file system, I contorted the bogus HTML into rudimentary XML so I could systematically read it for subsequent processing.
  3. Extract URLs – Using a 7-line program called bookmarks2urls.pl, I loop through the edited bookmarks file and output all the URLs.
  4. Mirror content – Because I want/need to retain a pristine version of the original texts, I feed the URLs to wget and copy the texts to a local directory. This use of wget is combined with the output of Step #3 through a brain-dead shell script called mirror.sh.
  5. Create corpus – The mirrored files are poorly named; using just the mirror it is difficult to know what “great book” hides inside files named annals.mb.txt, pg2600.txt, or whatever. Moreover, no metadata is associated with the collection. Consequently I wrote a program — build-corpus.pl — that loops through my edited bookmarks file, extracts the necessary metadata (author, title, and URL), downloads the remote texts, saves them locally with a human-readable filename, creates a rudimentary XHTML page listing each title, and creates an XML file containing all of the metadata generated to date.

The results of this 5-step process include:

The most important file, by far, is the metadata file. It is intended to be a sort of application- and operating system-independent database. Given this file, anybody ought to be able to duplicate the analysis I propose to do later. If there is only one file you download from this blog posting, it should be the metadata file — great-books.xml.

The collection process is not perfect. I was unable to find many of the works of Archimedes, Copernicus, Kepler, Newton, Galileo, or Freud. For all but Freud, I attribute this to the lack of translations, but I suppose I could stoop to the use of poorly OCR’ed texts from Google Books. I attribute the unavailability of Freud to copyright issues. There’s no getting around that one. A few times I located HTML versions of desired texts, but HTML will ultimately skew my analysis. Consequently I used a terminal-based program called lynx to convert and locally save the remote HTML to a plain text file. I then included that file into my corpus. Alas, there are always ways to refine collections. Like software, they are are never done.

Summary — Collection development, acquisitions, and cataloging

The process outlined above is really about librarianship and not software. Specifically, it is about collection development, acquisitions, and cataloging. I first needed to articulate a development policy. While it did not explicitly describe the policy it did outline why I wanted to create the collection as well as a few of each item’s necessary qualities. The process above implemented a way to actually get the content — acquisitions. Finally, I described — “cataloged” — my content, albiet in a very rudimentary form.

It is an understatement to say the Internet has changed the way data, information, and knowledge are collected, preserved, organized, and disseminated. By extension, librarianship needs to change in order to remain relevant with the times. Our profession spends much of its time trying to refine old processes. It is like trying to figure out how to improve the workings of a radio when people have moved on to the use of televisions instead. While traditional library processes are still important, they are not as important as the used to be.

The processes outline above illustrate one possible way librarianship can change the how’s of its work while retaining it’s what’s.

Inaugural Code4Lib “Midwest” Regional Meeting

June 12th, 2010

I believe the Inaugural Code4Lib “Midwest” Regional Meeting (June 11 & 12, 2010 at the University of Notre Dame) was a qualified success.

About twenty-six people attended. (At least that was the number of people who went to lunch.) They came from Michigan, Ohio, Iowa, Indiana, and Illinois. Julia Bauder won the prize for coming the furthest distance away — Grinnell, Iowa.


Day #1

We began with Lightning Talks:

  • ePub files by Michael Kreyche
  • FRBR and MARC data by Kelley McGrath
  • Great Books by myself
  • jQuery and the OPAC by Ken Irwin
  • Notre Dame and the Big Ten by Michael Witt
  • Solr & Drupal by Rob Casson
  • Subject headings via a Web Service by Michael Kreyche
  • Taverna by Rick Johnson and Banu Lakshminarayanan
  • VUFind on a hard disk by Julia Bauder

We dined in the University’s South Dining Hall, and toured a bit of the campus on the way back taking in the “giant marble”, the Architecture Library, and the Dome.

In the afternoon we broke up into smaller groups and discussed things including institutional repositories, mobile devices & interfaces, ePub files, and FRBR. In the evening we enjoyed varieties of North Carolina barbecue, and then retreated to the campus bar (Legend’s) for a few beers.

I’m sorry to say the Code4Lib Challenge was not successful. Us hackers were either to engrossed to notice whether or not anybody came to the event, or nobody showed up to challenge us. Maybe next time.


Day #2

There were fewer participants on Day #2. We spent the time listening to Ken elaborate on the uses and benefits of jQuery. I hacked at something I’m calling “The Great Books Survey”.

The event was successful in that it provided plenty of opportunity to discuss shared problems and solutions. Personally, I learned I need to explore statistical correlations, regressions, multi-varient analysis, and principle component analysis to a greater degree.

A good time was had by all, and it is quite possible the next “Midwest” Regional Meeting will be hosted by the good folks in Chicago.

For more detail about Code4Lib “Midwest”, see the wiki: http://wiki.code4lib.org/index.php/Midwest.

How “great” are the Great Books?

June 10th, 2010

In the 1952 a set of books called the Great Books of the Western World was published. It was supposed to represent the best of Western literature and enable the reader to further their liberal arts education. Sixty volumes in all, it included works by Plato, Aristotle, Shakespeare, Milton, Galileo, Kepler, Melville, Darwin, etc. (See Appendix A.) These great books were selected based on the way they discussed a set of 102 “great ideas” such as art, astronomy, beauty, evil, evolution, mind, nature, poetry, revolution, science, will, wisdom, etc. (See Appendix B.) How “great” are these books, and how “great” are the ideas expressed in them?

Given full text versions of these books it would be almost trivial to use the “great ideas” as input and apply relevancy ranking algorithms against the texts thus creating a sort of score — a “Great Ideas Coefficient”. Term Frequency/Inverse Document Frequency is a well-established algorithm for computing just this sort of thing:

relevancy = ( c / t ) * log( d / f )

where:

  • c = number of times a given word appears in a document
  • t = total number of words in a document
  • d = total number of documents in a corpus
  • f = total number of documents containing a given word

Thus, to calculate our Great Ideas Coefficient we would sum the relevancy score for each “great idea” for each “great book”. Plato’s Republic might have a cumulative score of 525 while Aristotle’s On The History Of Animals might have a cumulative score of 251. Books with a larger Coefficient could be considered greater. Given such a score a person could measure a book’s “greatness”. We could then compare the score to the scores of other books. Which book is the “greatest”? We could compare the score to other measurable things such as book’s length or date to see if there were correlations. Are “great books” longer or shorter than others? Do longer books contain more “great ideas”? Are there other books that were not included in the set that maybe should have been included? Instead of summing each relevancy score, maybe the “great ideas” can be grouped into gross categories such as humanities or sciences, and we can sum those scores instead. Thus we may be able to say one set of book is “great” when it comes the expressing the human condition and these others are better at describing the natural world. We could ask ourselves, which number of books represents the best mixture of art and science because their humanities score is almost equal to its sciences score. Expanding the scope beyond general education we could create an alternative set of “great ideas”, say for biology or mathematics or literature, and apply the same techniques to other content such as full text scholarly journal literatures.

The initial goal of this study is to examine the “greatness” of the Great Books, but the ultimate goal is to learn whether or not this quantitative process can be applied other bodies of literature and ultimately assist the student/scholar in their studies/research

Wish me luck.

Appendix A – Authors and titles in the Great Books series

  • AeschylusPrometheus Bound; Seven Against Thebes; The Oresteia; The Persians; The Suppliant Maidens
  • American State PapersArticles of Confederation; Declaration of Independence; The Constitution of the United States of America
  • ApolloniusOn Conic Sections
  • AquinasSumma Theologica
  • ArchimedesBook of Lemmas; Measurement of a Circle; On Conoids and Spheroids; On Floating Bodies; On Spirals; On the Equilibrium of Planes; On the Sphere and Cylinder; The Method Treating of Mechanical Problems; The Quadrature of the Parabola; The Sand-Reckoner
  • AristophanesEcclesiazousae; Lysistrata; Peace; Plutus; The Acharnians; The Birds; The Clouds; The Frogs; The Knights; The Wasps; Thesmophoriazusae
  • AristotleCategories; History of Animals; Metaphysics; Meteorology; Minor biological works; Nicomachean Ethics; On Generation and Corruption; On Interpretation; On Sophistical Refutations; On the Gait of Animals; On the Generation of Animals; On the Motion of Animals; On the Parts of Animals; On the Soul; Physics; Poetics; Politics; Posterior Analytics; Prior Analytics; Rhetoric; The Athenian Constitution; Topics
  • AugustineOn Christian Doctrine; The City of God; The Confessions
  • AureliusThe Meditations
  • BaconAdvancement of Learning; New Atlantis; Novum Organum
  • BerkeleyThe Principles of Human Knowledge
  • BoswellThe Life of Samuel Johnson, LL.D.
  • CervantesThe History of Don Quixote de la Mancha
  • ChaucerTroilus and Criseyde; The Canterbury Tales
  • CopernicusOn the Revolutions of Heavenly Spheres
  • DanteThe Divine Comedy
  • DarwinThe Descent of Man and Selection in Relation to Sex; The Origin of Species by Means of Natural Selection
  • DescartesDiscourse on the Method; Meditations on First Philosophy; Objections Against the Meditations and Replies; Rules for the Direction of the Mind; The Geometry
  • DostoevskyThe Brothers Karamazov
  • EpictetusThe Discourses
  • EuclidThe Thirteen Books of Euclid’s Elements
  • EuripidesAlcestis; Andromache; Bacchantes; Cyclops; Electra; Hecuba; Helen; Heracleidae; Heracles Mad; Hippolytus; Ion; Iphigeneia at Aulis; Iphigeneia in Tauris; Medea; Orestes; Phoenician Women; Rhesus; The Suppliants; Trojan Women
  • FaradayExperimental Researches in Electricity
  • FieldingThe History of Tom Jones, a Foundling
  • FourierAnalytical Theory of Heat
  • FreudA General Introduction to Psycho-Analysis; Beyond the Pleasure Principle; Civilization and Its Discontents; Group Psychology and the Analysis of the Ego; Inhibitions, Symptoms, and Anxiety; Instincts and Their Vicissitudes; New Introductory Lectures on Psycho- Analysis; Observations on “Wild” Psycho-Analysis; On Narcissism; Repression; Selected Papers on Hysteria; The Ego and the Id; The Future Prospects of Psycho-Analytic Therapy; The Interpretation of Dreams; The Origin and Development of Psycho- Analysis; The Sexual Enlightenment of Children; The Unconscious; Thoughts for the Times on War and Death
  • GalenOn the Natural Faculties
  • GalileoDialogues Concerning the Two New Sciences
  • GibbonThe Decline and Fall of the Roman Empire
  • GilbertOn the Loadstone and Magnetic Bodies
  • GoetheFaust
  • HamiltonThe Federalist
  • HarveyOn the Circulation of Blood; On the Generation of Animals; On the Motion of the Heart and Blood in Animals
  • HegelThe Philosophy of History; The Philosophy of Right
  • HerodotusThe History
  • HippocratesWorks
  • HobbesLeviathan
  • HomerThe Iliad; The Odyssey
  • HumeAn Enquiry Concerning Human Understanding
  • JamesThe Principles of Psychology
  • KantExcerpts from The Metaphysics of Morals; Fundamental Principles of the Metaphysic of Morals; General Introduction to the Metaphysic of Morals; Preface and Introduction to the Metaphysical Elements of Ethics with a note on Conscience; The Critique of Judgement; The Critique of Practical Reason; The Critique of Pure Reason; The Science of Right
  • KeplerEpitome of Copernican Astronomy; The Harmonies of the World
  • LavoisierElements of Chemistry
  • LockeA Letter Concerning Toleration; An Essay Concerning Human Understanding; Concerning Civil Government, Second Essay
  • LucretiusOn the Nature of Things
  • MachiavelliThe Prince
  • MarxCapital
  • Marx and EngelsManifesto of the Communist Party
  • MelvilleMoby Dick; or, The Whale
  • MillConsiderations on Representative Government; On Liberty; Utilitarianism
  • MiltonAreopagitica; English Minor Poems; Paradise Lost; Samson Agonistes
  • MontaigneEssays
  • MontesquieuThe Spirit of the Laws
  • NewtonMathematical Principles of Natural Philosophy; Optics; Twelfth Night; or, What You Will
    Christian Huygens
    ; Treatise on Light
  • NicomachusIntroduction to Arithmetic
  • PascalPensées; Scientific and mathematical essays; The Provincial Letters
  • PlatoApology; Charmides; Cratylus; Critias; Crito; Euthydemus; Euthyphro; Gorgias; Ion; Laches; Laws; Lysis; Meno; Parmenides; Phaedo; Phaedrus; Philebus; Protagoras; Sophist; Statesman; Symposium; The Republic; The Seventh Letter; Theaetetus; Timaeus
  • PlotinusThe Six Enneads
  • PlutarchThe Lives of the Noble Grecians and Romans
  • PtolemyThe Almagest
  • RabelaisGargantua and Pantagruel
  • RousseauA Discourse on Political Economy; A Discourse on the Origin of Inequality; The Social Contract
  • ShakespeareA Midsummer-Night’s Dream; All’s Well That Ends Well; Antony and Cleopatra; As You Like It; Coriolanus; Cymbeline; Julius Caesar; King Lear; Love’s Labour’s Lost; Macbeth; Measure For Measure; Much Ado About Nothing; Othello, the Moor of Venice; Pericles, Prince of Tyre; Romeo and Juliet; Sonnets; The Comedy of Errors; The Famous History of the Life of King Henry the Eighth; The First Part of King Henry the Fourth; The First Part of King Henry the Sixth; The Life and Death of King John; The Life of King Henry the Fifth; The Merchant of Venice; The Merry Wives of Windsor; The Second Part of King Henry the Fourth; The Second Part of King Henry the Sixth; The Taming of the Shrew; The Tempest; The Third Part of King Henry the Sixth; The Tragedy of Hamlet, Prince of Denmark; The Tragedy of King Richard the Second; The Tragedy of Richard the Third; The Two Gentlemen of Verona; The Winter’s Tale; Timon of Athens; Titus Andronicus; Troilus and Cressida
  • SmithAn Inquiry into the Nature and Causes of the Wealth of Nations
  • SophoclesAjax; Electra; Philoctetes; The Oedipus Cycle; The Trachiniae
  • SpinozaEthics
  • SterneThe Life and Opinions of Tristram Shandy, Gentleman
  • SwiftGulliver’s Travels
  • TacitusThe Annals; The Histories
  • ThucydidesThe History of the Peloponnesian War
  • TolstoyWar and Peace
  • VirgilThe Aeneid; The Eclogues; The Georgics

Appendix B – The “great” ideas

angel • animal • aristocracy • art • astronomy • beauty • being • cause • chance • change • citizen • constitution • courage • custom & convention • definition • democracy • desire • dialectic • duty • education • element • emotion • eternity • evolution • experience • family • fate • form • god • good & evil • government • habit • happiness • history • honor • hypothesis • idea • immortality • induction • infinity • judgment • justice • knowledge • labor • language • law • liberty • life & death • logic • love • man • mathematics • matter • mechanics • medicine • memory & imagination • metaphysics • mind • monarchy • nature • necessity & contingency • oligarchy • one & many • opinion • opposition • philosophy • physics • pleasure & pain • poetry • principle • progress • prophecy • prudence • punishment • quality • quantity • reasoning • relation • religion • revolution • rhetoric • same & other • science • sense • sign & symbol • sin • slavery • soul • space • state • temperance • theology • time • truth • tyranny • universal & particular • virtue & vice • war & peace • wealth • will • wisdom • world

Not really reading

June 9th, 2010

Using a number of rudimentary digital humanities computing techniques, I tried to practice what I preach and extract the essence from a set of journal articles. I feel like the process met with some success, but I was not really reading.

The problem

A set of twenty-one (21) essays on the future of academic librarianship was recently brought to my attention:

Leaders Look Toward the Future – This site compiled by Camila A. Alire and G. Edward Evans offers 21 essays on the future of academic librarianship written by individuals who represent a cross-section of the field from the largest institutions to specialized libraries.

Since I was too lazy to print and read all of the articles mentioned above, I used this as an opportunity to test out some of my “services against text” ideas.

The solution

Specifically, I used a few rudimentary digital humanities computing techniques to glean highlights from the corpus. Here’s how:

  1. First I converted all of the PDF files to plain text files using a program called pdftotext — a part of xpdf. I then concatenated the whole lot together, thus creating my corpus. This process is left up to you — the reader — as an exercise because I don’t have copyright hutzpah.
  2. Next, I used Wordle to create a word cloud. Not a whole lot of new news here, but look how big the word “information” is compared to the word “collections”.

  3. Using a program of my own design, I then created a textual version of the word cloud listing the top fifty most frequently used words and the number of times they appeared in the corpus. Again, not a whole lot of new news. The articles are obviously about academic libraries, but notice how the word “electronic” is listed and not the word “book”.
  4. Things got interesting when I created a list of the most significant two-word phrases (bi-grams). Most of the things are nouns, but I was struck by “will continue” and “libraries will” so I applied a concordance application to these phrases and got lists of snippets. Some of the more interesting ones include: libraries will be “under the gun” financially, libraries will be successful only if they adapt, libraries will continue to be strapped for staffing, libraries will continue to have a role to play, will continue their major role in helping, will continue to be important, will continue to shift toward digital information, will continue to seek new opportunities.

Yes, there may very well be some subtle facts I missed by not reading the full texts, but I think I got a sense of what the articles discussed. It would be interesting to sit a number of people down, have them read the articles, and then have them list out a few salient sentences. To what degree would their result be the same or different from mine?

I was able to write the programs from scratch, do the analysis, and write the post in about two hours, total. It would have taken me that long to read the articles. Just think what a number of librarians could do, and how much time could be saved if this system were expanded to support just about any plain text data.

Cyberinfrastructure Days at the University of Notre Dame

May 23rd, 2010

ci daysOn Thursday and Friday, April 29 and 30, 2010 I attended a Cyberinfrastructure Days event at the University of Notre Dame. Through this process my personal definition of “cyberinfrastructure” was updated, and my basic understanding of “digital humanities computing” was confirmed. This posting documents the experience.

Day #1 – Thursday, April 29

The first day was devoted to cyberinfrastructure and the humanities.

After all of the necessary introductory remarks, John Unsworth (University of Illinois – Urbana/Champagne) gave the opening keynote presentation entitled “Reading at library scale: New methods, attention, prosthetics, evidence, and argument“. In his talk he posited the impossibility of reading everything currently available. There is just too much content. Given some of the computing techniques at our disposal, he advocated additional ways to “read” material, but cautioned the audience in three ways: 1) there needs to be an attention to prosthetics, 2) an appreciation for evidence and statistical significance, and 3) a sense of argument so the skeptic may be able to test the method. To me this sounded a whole lot like applying scientific methods to the process of literary criticism. Unsworth briefly described MONK and elaborated how part of speech tagging had been done against the corpus. He also described how Dunning’s Log-Likelihood statistic can be applied to texts in order to determine what a person does (and doesn’t) include in their writings.

Stéfan Sinclair (McMaster University) followed with “Challenges and opportunities of Web-based analytic tools for the humanities“. He gave a brief history of the digital humanities in terms of computing. Mainframes and concordances. Personal computers and even more concordances. Webbed interfaces and locally hosted texts. He described digital humanities as something that has evolved in cycles since at least 1967. He advocated the new tools will be Web apps — things that can be embedded into Web pages and used against just about any text. His Voyeur Tools were an example. Like Unsworth, he advocated the use of digital humanities computing techniques because they can supplement the analysis of texts. “These tools allow you to see things that are not evident.” Sinclair will be presenting a tutorial at the annual digital humanities conference this July. I hope to attend.

In a bit of change of pace, Russ Hobby (Internet2) elaborated on the nuts & bolts of cyberinfrastructure in “Cyberinfrastructure components and use“. In this presentation I learned that many scientists are interested in the… science, and they don’t really care about the technology supporting it. They have an instrument in the field. It is collecting and generating data. They want to analyze that data. They are not so interested in how it gets transported from one place to another, how it is stored, or in what format. As I knew, they are interested in looking for patterns in the data in order to describe and predict events in the natural world. “Cyberinfrastructure is like a car. ‘Car, take me there.'” Cyberinfrastructure is about controls, security systems, storage sets, computation, visualization, support & training, collaboration tools, publishing, communication, finding, networking, etc. “We are not there to answer the question, but more to ask them.”

In the afternoon I listened to Richard Whaling (University of Chicago) present on “Humanities computing at scale“. Given from the point of view of a computer scientist, this presentation was akin to Hobby’s. On one hand there are people do analysis and there are people who create the analysis tools. Whaley is more like the later. I thought his discussion on the format of texts was most interesting. “XML is good for various types of rendering, but not necessarily so good for analysis. XML does not necessarily go deep enough with the encoding because the encoding is too expensive; XML is not scalable. Nor is SQL. Indexing is the way to go.” This perspective jives with my own experience. Encoding texts in XML (TEI) is so very tedious and the tools to do any analysis against the result are few and far between. Creating the perfect relational database (SQL) is like seeking the Holy Grail, and SQL is not designed to do full text searching nor “relevancy ranking”. Indexing texts and doing retrieval against the result has proven to be much more fruitful or me, but such an approach is an example of “Bag of Words” computing, and thus words (concepts) often get placed out of context. Despite that, I think the indexing approach holds the most promise. Check out Perseus under Philologic and Digital South Asia Library to see some of Whaley’s handiwork.

Chris Clarke (University of Notre Dame), in “Technology horizons for teaching and learning“, enumerated ways the University of Notre Dame is putting into practice many of the things described in the most recent Horizon Report. Examples included the use of ebooks, augmented reality, gesture-based computing, and visual data analysis. I thought the presentation was a great way to bring the forward-thinking report down to Earth and place it into a local context. Very nice.

William Donaruma (also from the University of Notre Dame) described the process he was going through to create 3-D movies in a presentation called “Choreography in a virtual space“. Multiple — very expensive — cameras. Dry ice. Specific positioning of the dancers. Special glasses. All of these things played into the creation of an illusion of three-dimensions on a two-dimensional space. I will not call it three-dimensional until I can walk around the object in question. The definition of three-dimensional needs to be qualified.

The final presentation of the day took place after dinner. The talk, “The Transformation of modern science” was given virtually by Edward Seidel (National Science Foundation). Articulate. Systematic. Thorough. Insightful. These are the sorts of words I use to describe Seidel’s talk. Presented remotely through a desktop camera and displayed on a screen to the audience, we were given a history of science and a description of how it has changed from single-man operations to large-group collaborations. We were shown the volume of information created previously and compared it to the volume of information generated now. All of this led up to the most salient message — “All future National Science Foundation grant proposals must include a data curation plan.” Seidel mentioned libraries, librarians, and librarianship quite a number of times during the talk. Naturally my ears perked up. My profession is about the collection, preservation, organization, and dissemination of data, information, and knowledge. The type of content to which these processes are applied — books, journal articles, multi-media recordings, etc — is irrelevant. Given a collection policy, it can all be important. The data generated by scientists and their machines is no exception. Is our profession up to the challenge, or are we too much wedded to printed, bibliographic materials? It is time for librarians to aggressively step up to the plate, or else. Here is an opportunity being laid at our feet. Let’s pick it up!

Day #2 – Friday, April 30

The second day centered more around the sciences as opposed to the humanities.

The day began with a presentation by Tony Hey (Microsoft Research) called “The Fourth Paradigm: Data-intensive scientific discovery“. Hey described cyberinfrastructure as the new name for e-science. He then echoed much of content of Seidel’s message from the previous evening and described the evolution of science in a set of paradigms: 1) theoretical, 2) experimental, 3) computational, and 4) data-intensive. He elaborated on the infrastructure components necessary for data-intensive science: 1) acquisition, 2) collaboration & visualization, 3) analysis & mining, 4) dissemination & sharing, 5) archiving & preservation. (Gosh, that sounds a whole lot like my definition of librarianship!) He saw Microsoft’s role as one of providing the necessary tools to facilitate e-science (or cyberinfrastructure) and thus the Fourth Paradigm. Hey’s presentation sounded a lot like open access advocacy. More Association of Research Library library directors as well as university administrators need to hear what he has to say.

Boleslaw Syzmanski (Rensselaer Polytechnic Institute) described how better science could be done in a presentation called “Robust asynchronous optimization for volunteer computing grids“. Like Hobby and Whaley mentioned (above), Syzmanski separated the work of the scientist and the work of cyberinfrastructure. “Scientists do not want to be bothered with the computer science of their work.” He then went on to describe a distributed computing technique for studying the galaxy — MilkyWay@home. He advocated cloud computing as a form of asynchronous computing.

The third presentation of the day was entitled “Cyberinfrastructure for small and medium laboratories” by Ian Foster (University of Chicago). The heart of this presentation was advocacy for software as a service (SaaS) computing for scientific laboratories.

Ashok Srivastava (NASA) was the first up in the second session with “Using Web 2.0 and collaborative tools at NASA“. He spoke to one of the basic principles of good science when he said, “Reproducibility is a key aspect of science, and with access to the data this reproducibility is possible.” I’m not quite sure my fellow librarians and humanists understand the importance of such a statement. Unlike work in the humanities — which is often built on subjective and intuitive interpretation — good science relies on the ability for many to come to the same conclusion based on the same evidence. Open access data makes such a thing possible. Much more of Srivastava’s presentation was about DASHlink, “a virtual laboratory for scientists and engineers to disseminate results and collaborate on research problems in health management technologies for aeronautics systems.”

Scientific workflows and bioinformatics applications” by Ewa Deelman (University of Southern California) was up next. She echoed many of the things I heard from library pundits a few years ago when it came to institutional repositories. In short, “Workflows are what are needed in order for e-science to really work… Instead of moving the data to the computation, you have to move the computation to the data.” This is akin to two ideas. First, like Hey’s idea of providing tools to facilitate cyberinfrastructure, Deelman advocates integrating the cyberinfrastructure tools into the work of scientists. Second, e-science is more than mere infrastructure. It also approaches the “services against text” idea which I have been advocating for a few years.

Jeffrey Layton (Dell, Inc.) rounded out the session with a presentation called “I/O pattern characterization of HPC applications“. In it he described how he used the output of strace commands — which can be quite voluminous — to evaluate storage input/output patterns. “Storage is cheap, but it is only one of a bigger set of problems in the system.”

By this time I was full, my iPad had arrived in the mail, and I went home.

Observations

It just so happens I was given the responsibility of inviting a number of the humanists to the event, specifically: John Unsworth, Stéphan Sinclair, and Richard Whaley. That is was an honor, and I appreciate the opportunity. “Thank you.”

I learned a number of things, and a few other things were re-enforced. First, the word “cyberinfrastructure” is the newly minted term for “e-science”. Many of the presenters used these two words interchangeably. Second, while my experience with the digital humanities is still in its infancy, I am definitely on the right track. Concordances certainly don’t seem to be going out of style any time soon, and my use of indexes is a movement in the right direction. Third, the cyberinfrastructure people see themselves as support to the work of scientists. This is similar to the work of librarians who see themselves supporting their larger communities. Personally, I think this needs to be qualified since I believe it is possible for me to expand the venerable sphere of knowledge too. Providing library (or cyberinfrastructure) services does not preclude me from advancing our understanding of the human condition and/or describing the natural world. Lastly, open source software and open access publishing were common underlying themes but not rarely explicitly stated. I wonder whether or not the the idea of “open” is a four letter word.

About Infomotions Image Gallery: Flickr as cloud computing

May 22nd, 2010

Infomotions Image GalleryThis posting describes the whys and wherefores behind the Infomotions Image Gallery.

Photography

I was introduced to photography during library school, specifically, when I took a multi-media class. We were given film and movie cameras, told to use the equipment, and through the process learn about the medium. I took many pictures of very tall smoke stacks and classical-looking buildings. I also made a stop-action movie where I step-by-step folded an origami octopus and underwater sea diver while a computer played the Beatles’ “Octopuses Garden” in the background. I’d love to resurrect that 16mm film.

I was introduced to digital photography around 1995 when Steve Cisler (Apple Computer) gave me a QuickTake camera as a part of a payment for writing a book about Macintosh-based HTTP servers. That camera was pretty much fun. If I remember correctly, it took 8-bit images and could store about twenty-four of them at a time. The equipment worked perfectly until my wife accidentally dropped it into a pond. I still have the camera, somewhere, but it only works if it is plugged into an electrical socket. Since then I’ve owned a few other digital cameras and one or two digital movie cameras. They have all been more than simple point-and-shoot devices, but at the same time, they have always had more features than I’ve ever really exploited.

Over the years I mostly used the cameras to document the places I’ve visited. I continue to photograph buildings. I like to take macro shots of flowers. Venuses are always appealing. Pictures of food are interesting. In the self-portraits one is expected to notice the background, not necessarily the subject of the image. I believe I’m pretty good at composition. When it comes to color I’m only inspired when the sun is shining bright, and that makes some of my shots overexposed. I’ve never been very good at photographing people. I guess that is why I prefer to take pictures of statues. All things library and books are a good time. I wish I could take better advantage of focal lengths in order blur the background but maintain a sharp focus in the foreground. The tool requires practice. I don’t like to doctor the photographs with effects. I don’t believe the result represents reality. Finally, I often ask myself an aesthetic question, “If I was looking through the camera to take the picture, then did I really see what was on the other side?” After all, my perception was filtered through an external piece of equipment. I guess I could ask the same question of all my perceptions since I always wear glasses.

The Infomotions Image Gallery is simply a collection of my photography, sans personal family photos. It is just another example of how I am trying to apply the principles of librarianship to the content I create. Photographs are taken. Individual items are selected, and the collection is curated. Given the available resources, metadata is applied to each item, and the whole is organized into sets. Every year the newly created images are archived to multiple mediums for preservation purposes. (I really ought to make an effort to print more of the images.) Finally, an interface is implemented allowing people to access the collection.

Enjoy.

orange hot stained glassTilburg University sculpturecoastal homebeach sculpturemetal bookthistleDSCN5242Three Sisters

Fickr as cloud computing

This section describes how the Gallery is currently implemented.

About ten years ago I began to truly manage my photo collection using Apple’s iPhoto. At just about the same time I purchased an iPhoto add-on called BetterHTMLExport. Using a macro language, this add-on enabled me to export sets of images to index and detail pages complete with titles, dates, and basic numeric metadata such as exposure, f-stop, etc. The process worked but the software grew long in the tooth, was sold to another company, and was always a bit cumbersome. Moreover, maintaining the metadata was tedious inhibiting my desire to keep it up to date. Too much editing here, exporting there, and uploading to the third place. To make matters worse, people expect to comment on the photos, put them into their own sets, and watch some sort of slide show. Enter Flickr and a jQuery plug-in called ColorBox.

After learning how to use iPhoto’s ability to publish content to Flickr, and after taking a closer look at Flickr’s application programmer interace (API), I decided to use Flickr to host my images. The idea was to: 1) maintain the content on my local file system, 2) upload the images and metadata to Flickr, and 3) programmatically create in interface to the content on my website. The result was a more streamlined process and a set of Perl scripts implementing a cleaner user interface. I was entering the realm of cloud computing. The workflow is described below:

  1. Take photographs – This process is outlined in the previous section.
  2. Import photographs – Import everything, but weed right away. I’m pretty brutal in this regard. I don’t keep duplicate nor very similar shots. No (or very very few) out-of-focus or poorly composed shots are kept either.
  3. Add titles – Each photo gets some sort of title. Sometimes they are descriptive. Sometimes they are rather generic. After all, how many titles can different pictures of roses have? If I were really thorough I would give narrative descriptions to each photo.
  4. Make sets – Group the imported photos into a set and then give a title to the set. Again, I ought to add narrative descriptions, but I don’t. Too lazy.
  5. Add tags – Using iPhoto’s keywords functionality, I make an effort to “tag” each photograph. Tags are rather generic: flower, venus, church, me, food, etc.
  6. Publish to Flickr – I then use iPhoto’s sharing feature to upload each newly created set to Flickr. This works very well and saves me the time and hassle of converting images. This same functionality works in reverse. If I use Flickr’s online editing functions, changes are reflected on my local file system after a refresh process is done. Very nice.
  7. Re-publish to Infomotions – Using a system of Perl scripts I wrote called flickr2gallery I then create sets of browsable pages from the content saved on Flickr.

Using this process I can focus more on my content and less on my presentation. It makes it easier for me to focus on the images and their metadata and less on how the content will be displayed. Graphic design is not necessarily my forte.

Flickr2gallery is a suite of Perl scripts and plain text files:

  1. tags2gallery.pl – Used to create pages of images based on photos’ tags.
  2. sets2gallery.pl – Used to create pages of image sets as well as the image “database”.
  3. make-home.pl – Used to create the Image Gallery home page.
  4. flickr2gallery.sh – A shell script calling each of the three scripts above and thus (re-)building the entire Image Gallery subsite. Currently, the process takes about sixty seconds.
  5. images.db – A tab-delimited list of each photograph’s local home page, title, and Flickr thumbnail.
  6. Images.pm – A really-rudimentary Perl module containing a single subroutine used to return a list of HTML img elements filled with links to random images.
  7. random-images.pl – Designed to be used as a server-side include, calls Images.pm to display sets of random images from images.db.

I know the Flickr API has been around for quite a while, and I know I’m a Johnny Come Lately when it comes to learning how to use it, but that does not mean it can’t be outlined here. The API provides a whole lot of functionality. Reading and writing of image content and metadata. Reading and writing information about users, groups, and places. Using the REST-like interface the programmer constructs a command in the form of a URL. The URL is sent to Flickr via HTTP. Responses are returned in easy-to-read XML.

A good example is the way I create my pages of images with a given tag. First I denote a constant which is the root of a Flickr tag search. Next, I define the location of the Infomotions pages on Flickr. Then, after getting a list of all of my tags, I search Flickr for images using each tag as a query. These results are then looped through, parsed, and built into a set of image links. Finally, the links are incorporated into a template and saved to a local file. Below lists the heart of the process:

  use constant S => 'http://api.flickr.com/services/rest/?
                                  method=flickr.photos.search&
                                  api_key=YOURKEY&user_id=YOURID&tags=';
  use constant F => 'http://www.flickr.com/photos/infomotions/';
  
  # get list of all tags here
  
  # find photos with this tag
  $request  = HTTP::Request->new( GET => S . $tag );
  $response = $ua->request( $request );
  
  # process each photo
  $parser    = XML::XPath->new( xml => $response->content );
  $nodes     = $parser->find( '//photo' );
  my $cgi    = CGI->new;
  my $images = '';
  foreach my $node ( $nodes->get_nodelist ) {
  
  # parse
  my $id     = $node->getAttribute( 'id' );
  my $title  = $node->getAttribute( 'title' );
  my $farm   = $node->getAttribute( 'farm' );
  my $server = $node->getAttribute( 'server' );
  my $secret = $node->getAttribute( 'secret' );
  
  # build image links
  my $thumb = "http://farm$farm.static.flickr.com/$server/$id" . 
              '_' . $secret . '_s.jpg';
  my $full  = "http://farm$farm.static.flickr.com/$server/$id" . 
              '_' . $secret . '.jpg';
  my $flickr = F . "$id/";
    
  # build list of images
  $images .= $cgi->a({ href => $full, 
                       rel => 'slideshow',
                       title => "<a href='$flickr'>Details on Flickr</a>"
                      },
                      $cgi->img({ alt => $title, src => $thumb, 
                      border => 0, hspace => 1, vspace => 1 }));
    
  }
  
  # save image links to file here

Notice the rel attribute (slideshow) in each of the images’ anchor elements. These attributes are used as selectors in a jQuery plug-in called ColorBox. In the head of each generated HTML file is a call to ColorBox:

  <script type="text/javascript">
    $(document).ready(function(){
      $("a[rel='slideshow']").colorbox({ slideshowAuto: false, 
                                         current: "{current} of {total}",
                                         slideshowStart: 'Slideshow',
                                         slideshowStop: 'Stop',
                                         slideshow: true,
                                         transition:"elastic" });
      });
  </script>

Using this plug-in I am able to implement a simple slideshow when the user clicks on any image. Each slideshow display consists of simple navigation and title. In my case the title is really a link back to Flickr where the user will be able to view more detail about the image, comment, etc.

barn ceilingkilnHesburgh Libraryself-portraitGiant EraserbirdsChristian Scientist ChurchRedwood Library

Summary and conclusion

I am an amateur photographer, and the fruits of this hobby are online here for sharing. If you use them, then please give credit where credit is due.

The use of Flickr as a “cloud” to host my images is very useful. It enables me to mirror my content in more than one location as well as provide access in multiple ways. When the Library of Congress announced they were going to put some of their image content on Flickr I was a bit taken aback, but after learning how the Flickr API can be exploited I think there are many opportunities for libraries and other organizations to do the same thing. Using the generic Flickr interface is one way to provide access, but enhanced and customized access can be implemented through the API. Lots of food for thought. Now to apply the same process to my movies by exploiting YouTube.

Shiny new website

May 20th, 2010

Infomotions has a shiny new website, and the process to create it was not too difficult.

The problem

A relatively long time ago (in a galaxy far far away), I implemented an Infomotions website look & feel. Tabbed interface across the top. Local navigation down the left-hand side. Content in the middle. Footer along the bottom. Typical. Everything was rather square. And even though I used pretty standard HTML and CSS, its implementation was not really conducive to Internet Explorer. My bad.

Moreover, people’s expectations have increased dramatically since I first implemented my site’s look & feel. Curved lines. Pop-up windows. Interactive AJAX-like user experiences. My site was definitely not Web 2.0 in nature. Static. Not like a desktop application.

Finally, as time went on my site’s look & feel was not as consistently applied as I had hoped. Things were askew and the whole thing needed refreshing.

The solution

My ultimate solution is rooted in jQuery and its canned themes.

As you may or may not know, jQuery is a well-supported Javascript library supporting all sorts of cool things like drag ‘n drop, sliders, many animations, not to mention a myriad of ways to manipulate the Document Object Model (DOM) of HTML pages. An extensible framework, jQuery is also the foundation for many plug-in modules.

Just as importantly, jQuery supports a host of themes — CSS files implementing various looks & feels. These themes are very standards compliant and work well on all browsers. I was particularly enamored with the tabbed menu with rounded corners. (Under the hood, these rounded corners are implemented by a browser framework called Webkit. Let’s keep our eye on that one.) After learning how to implement the tabbed interface without the use of Javascript, I was finally on my way. As Dan Brubakerhorst said to me, “It is nothing but styling.”

None of Infomotions subsites are driven by hand-coded HTML. Everything comes from some sort of script. The Alex Catalogue is a database-driven website with mod-Perl modules. The water collection is supported by a database plus XSLT transformations of XML on the fly. The blog is WordPress. My “musings” are sets of TEI files converted in bulk into HTML. While it took a bit of tweaking in each of these subsites, the process was relatively painless. Insert the necessary divs denoting the menu bar, left-hand navigation, and content into my frameworks. Push the button. Enjoy. If I want to implement a different color scheme or typography, then I simply change a single CSS file for the entire site. In retrospect, the most difficult thing for me to convert was my blog. I had to design my own theme. Not too hard, but definitely a learning curve.

A feature I feel pretty strongly about is printing. The Web is one medium. Content on paper is another medium. They are not the same. In general, websites have more of a landscape orientation. Printed mediums more or less have portrait orientations. In the printed medium there is no need for global navigation, local navigation, nor hyperlinks. Silly. Margins need to be accounted for. Pages need to be signed, dated, and branded. Consequently, I wrote a single print-based CSS file governing the entire site. Pages print quite nicely. So nicely I may very well print every single page from my website and bind the whole thing into a book. Call it preservation.

In many ways I consider myself to be an artist, and the processes of librarianship are my mediums. Graphic design is not my forte, but I feel pretty good about my current implementation. Now I need to get back to the collection, organization, preservation, and dissemination of data, information, and knowledge.

Counting words

April 10th, 2010

When I talk about “services against text” I usually get blank stares from people. When I think about it more, many of the services I enumerate are based on the counting of words. Consequently, I spent some time doing just that — counting words.

I wanted to analyze the content of a couple of the mailing lists I own/moderate, specifically Code4Lib and NGC4Lib. Who are the most frequent posters? What words are used most often in the subject lines, and what words are used most often in the body of the messages? Using a hack I wrote (mine-mail.pl) I was able to generate simple tables of data:

I then fed these tables to Wordle to create cool looking images. I also fed these tables to a second hack (dat2cloud.pl) to create not-even-close-to-valid HTML files in the form of hyperlinked tag clouds. Below is are the fruits of these efforts:


image of names

tag cloud of names

image of subjects

tag cloud of subjects

image of words

tag cloud of words

The next step is to plot the simple tables on a Cartesian plane. In other words, graph the data. Wish me luck.

My first ePub file

March 21st, 2010

I made available my first ePub file today.

screen shot
Screen shot

EPub is the current de facto standard file format for ebook readers. After a bit of reading, the format is not too difficult since all the files are plain-text XML files or images. The various metadata files are ePub-specific XML. The content is XHTML. The graphics can be in any number of formats. The whole lot is compressed into a single file using the zip “standard”, and suffixed with a .epub extension.

Since much of my content has been previously saved as TEI files, the process of converting my content into ePub is straight-forward. Use XPath to extract metadata. Use XSLT to transform the TEI to XHTML. Zip up the whole thing and make it available on the Web. I have found the difficult part to be the images. It is hard to figure out where one’s images are saved and then incorporate them into the ePub file. I will have to be a bit more standard with my image locations in the future and/or I will need to do a bit of a retrospective conversion process. (I probably will go the second route. Crazy.)

Loading my ePub into Firefox’s EPUBReader worked just fine. The whole thing rendered pretty well in Stanza too. More importantly, it validated against a Java-based tool called epubcheck. Whew!

While I cogitate how to convert my content, you can download my first ePub file as well as the beginnings of my ePub creation script.

Enjoy?

P.S. I think the Apple iPad is going to have a significant impact on digital reading in the very near future. I’m preparing.

Alex Catalogue Widget

March 15th, 2010

I created my first Apple Macintosh Widget today — Alex Catalogue Widget.

Alex Catalogue Widget

The tool is pretty rudimentary. Enter something into the field. Press return or click the Search button. See search results against the Alex Catalogue of Electronic Texts displayed in your browser. The development process reminded me of hacking in HyperCard. Draw things on the screen — buttons, fields, etc. — and assocate actions (events) with each of them.

Download it and try it for yourself.

Michael Hart in Roanoke (Indiana)

March 7th, 2010

On Saturday, February 27, Paul Turner and I made our way to Roanoke (Indiana) to listen to Michael Hart tell stories about electronic texts and Project Gutenberg. This posting describes our experience.

Roanoke and the library


To celebrate its 100th birthday, the Roanoke Public Library invited Michael Hart of Project Gutenberg fame to share his experience regarding electronic texts in a presentation called “Books & eBooks: Past, Present & Future Libraries”. The presentation was scheduled to start around 3 o’clock, but Paul Turner and I got there more than an hour early. We wanted to have time to visit the Library before it closed at 2 o’clock. The town of Roanoke (Indiana) — a bit south west of Fort Wayne — was tiny by just about anybody’s standard. It sported a single blinking red light, a grade school, a few churches, one block of shops, and a couple of eating establishments. According to the man in the bar, the town got started because of the locks that had been built around town.

The Library was pretty small too, but it bursted with pride. About 1,800 square feet in size, it was overflowing with books and videos. There were a couple of comfy chairs for adults, a small table, a set of four computers to do Internet things, and at least a few clocks the wall. They were very proud of the fact that they had become an Evergreen library as a part Evergreen Indiana initiative. “Now is is possible to see what is owned in other, nearby libraries, and borrow things from them as well,” said the Library’s Board Director.

Michael Hart

The presentation itself was not held in the Library but in a nearby church. About fifty (50) people attended. We sat in the pews and contemplated the symbolism of the stained glass windows and wondered how the various hardware placed around the alter was going to be incorporated into the presentation.

Full of smiles and joviality, Michael Hart appeared in a tailless tuxedo, cumber bun, and top hat. “I am now going to pull a library out of my hat,” he proclaimed, and proceeded to withdraw a memory chip. “This chip contains 10’s of thousands of books, and now I’m going to pull a million books out of my pocket,” and he proceed to display a USB drive. Before the year 2020 he sees us capable of carrying around a billion books on some sort of portable device. Such was the essence of his presentation — computer technology enables the distribution and acquisition of “books” in ways never before possible. Through this technology he wants to change the world. “I consider myself to be like Johnny Appleseed, and I’m spreading the word,” at which time I raised my hand and told him Johnny Appleseed (John Chapman) was buried just up the road in Fort Wayne.

Mr. Hart displayed and described a lot of antique hardware. A hard drive that must have weighed fifty (50) pounds. Calculators. Portable computers. Etc. He illustrated how storage mediums were getting smaller and smaller while being able to save more and more data. He was interested in the packaging of data and displayed a memory chip a person can buy from Walmart containing “all of the hit songs from the 50’s and 60’s”. (I wonder how the copyright issues around that one had been addressed.) “The same thing,” he said, “could be done for books but there is something wrong with the economics and the publishing industry.”

Roanoke (Indiana)
Roanoke (Indiana)
pubic library
public library

He outlined how Project Gutenberg works. First a book is identified as a possible candidate for the collection. Second, the legalities of the making the book available are explored. Next, a suitable edition of the book is located. Fourth, the book’s content is transcribed or scanned. Finally, 100’s of people proof-read the result and ultimately make it available. Hart advocated getting the book out sooner rather than later. “It does not have to be perfect, and we can always the fix errors later.”

He described how the first Project Gutenberg item came into existence. In a very round-about and haphazard way, he enrolled in college. Early on he gravitated towards the computer room because it was air conditioned. Through observation he learned how to use the computer, and to do his part in making the expense of the computer worthwhile, he typed out the United States Declaration of the Independence on July 4th, 1971.

“Typing the books is fun,” he said. “It provides a means for reading in ways you had never read them before. It is much more rewarding than scanning.” As a person who recently learned how to bind books and as a person who enjoys writing in books, I asked Mr. Hart to compare & contrast ebooks, electronic texts, and codexes. “The things Project Gutenberg creates are electronic texts, not ebooks. They are small, portable, easily copyable, and readable by any device. If you can’t read a plain text document on your computer, then you have much bigger problems. Moreover, there is an enormous cost-benefit compared to printed books. Electronic texts are cheap.” Unfortunately, he never really answered the question. Maybe I should have phrased it differently and asked him, the way Paul did, to compare the experience of reading physical books and electronic texts. “I don’t care if it looks like a book. Electronic texts allow me to do more reading.”

“Two people invented open source. Me and Richard Stallman,” he said. Well, I don’t think this is exactly true. Rather, Richard Stahlman invented the concept of GNU software, and Michael Hart may have invented the concept of open access publishing. But the subtle differences between open source software and open access publishing are lost on most people. In both cases the content is “free”. I guess I’m too close to the situation. I too see open source software distribution and open access publishing having more things in common than differences.

church
church
church
stained glass

“I knew Project Gutenberg was going to be success when I was talking on the telephone with a representative of the Common Knowledge project and heard a loud crash on the other end of the line. It turns out the representative’s son and friends had broken an annorandak chair while clamoring to read an electronic text.” In any case, he was fanatically passionate about giving away electronic texts. He sited the World eBook Fair, and came to the presentation with plenty of CD’s for distribution.

In the end I had my picture taken with Mr. Hart. We then all retired to the basement for punch and cake where we sang Happy Birthday to Michael. Two birthdays celebrated at the same time.

Reflection

Michael and Eric
Michael and Eric

Many people are drawn to the library profession as a matter of principle. Service to others. Academic freedom. Preservation of the historical record. I must admit that I am very much the same way. I was drawn to librarianship for two reasons. First, as a person with a BA in philosophy, I saw libraries as a places full of ideas, literally. Second, I saw the profession as a growth industry because computers could be used to disseminate the content of books. In many ways my gut feelings were accurate, but at the same time they were misguided because much of librarianship surrounds workflows, processes that are only a couple of steps away from factory work, and the curation of physical items. To me, just like Mr. Hart, the physical item is not as important as what it manifests. It is not about the book. Rather, it is what is inside the book. Us librarians have tied our identities to the physical book in such a way to be limiting. We have pegged ourselves, portrayed a short-sighted vision, and consequently painted ourselves into a corner. It the carpenter a hammer expert? Is the surgeon a scalpel technician? No, they are builders and healers, respectively. Why must librarianship be identified with books?

I have benefited from Mr. Hart’s work. My Alex Catalogue of Electronic Texts contains many Project Gutenberg texts. Unlike the books from the Internet Archive, the texts are much more amenable to digital humanities computing techniques because they have been transcribed by humans and not scanned by computers. At the same time, the Project Gutenberg texts are not formatted as well for printing or screen display as PDF versions of the same. This is why the use of electronic texts and ebooks is not an either/or situation but rather a both/and, especially when it comes to analysis. Read a well-printed book. Identify item of interest. Locate item in electronic version of book. Do analysis. Return to printed book. The process could work just as well the other way around. Ask a question of the electronic text. Get one or more answers. Examine them in the context of the printed word. Both/and, not either/or.

The company was great, and the presentation was inspiring. I applaud Michael Hart for his vision and seemingly undying enthusiasm. His talk made me feel like I really am on the right track, but change takes time. The free distribution of data and information — whether the meaning of free be denoted as liberty or gratis — is the right thing to do for society in general. We all benefit, and therefore the individual benefits as well. The political “realities” of the situation are more like choices and not Platonic truths. They represent immediate objectives as opposed to long-term strategic goals. I guess this is what you get when you mix the corporeal and ideal natures of humanity.

Who would have known that a trip to Roanoke would turn out to be a reflection of what it means to be human.

Preservationists have the most challenging job

January 3rd, 2010

In the field of librarianship, I think the preservationists have the most challenging job because it is fraught with the greatest number of unknowns.

Twenty-eight (28) CDs

mangled book
mangled book

As I am writing this posting, I am in the middle of an annual processes — archiving the data I created from the previous year. This is something I have been doing since 1986. It began by putting my writings on 3.5 inch “floppy” disks. After a few years, CDs became more feasible, and I have been using them ever since. The first few CDs contain multiple years’ worth of content. This year I will require 14 CDs, and considering the fact that I create duplicates of every CD, this year I will burn 28. It goes with too much saying, this process takes a long time.

Now, I’m not quite a prolific a writer as 28 CDs sound, but the type of content I archive is large and diverse. It begins with my email which I have been systematically collecting since 1997. (“Can you say, ‘Mr. Serials’?”) No, I do not have all of my email, just the email I think is important; email of a significant nature where I actually say something, or somebody actually says something to me. It includes some attachments in the form of PDF documents and image files. It includes, inquiries I get regarding my work and postings to mailing lists that are longer rather than shorter. By the way, I only send plain text email messages because MIME encodings — the process used to include other than plain text content — adds an extra layer of complexity when it comes to reading and parsing email (mbox) archives. How can I be sure future digital archeologists will be able to compute against such stuff? Likewise, nothing gets tape archived (“tarred”), and nothing gets compressed (“zipped”) for all for the same reasons — an extra layer of complexity. Since I am the “owner” of the Code4Lib, NGC4Lib, and Usability4Lib mailing lists, and since was used to be the official archivist for ACQNET, I systematically collect, organize, archive, index, and provide access to these mailing lists using Mr. Serials. Burning the raw (mbox) email files of these lists as well as their browsable HTML counterparts is a part of my annual email preservation process.

The proces continues with the various types of other writings. Each presentation I give has its own folder complete with invitation, logistics, bio & abstract, as well three versions of my presentation: 1) a plain-text version, a one-page handout in the form of a PDF file, and a Word document. (Ick!) If I’m lucky I will remember to archive the TEI version of my remarks which is always longer than one page long and lives in the Musings section of Infomotions. Other types of writings include the plain text versions of blog postings, various versions of essays for publication, etc. At the very least, everything is saved as plain text. Not Word. Not PDF. Not anything that is platform or software-title specific. Otherwise I can’t guarantee it will be readable into the next decade. I figure that if someone can’t read a plain text file, then they have much bigger problems.

Then there is the software. I write lots of software over the period of one year. At least a couple dozen programs. Some of them are simple hacks. Some of them are “studies”, experiments, or investigations. Some of them are extensive intermediaries between relational databases and people using Web browsers. While many of these programs come to me in bursts of creative energy, I would not have the ability to recreate them if they were lost and gone to Big Byte Heaven. When it comes to computers, your data is your most important assest. Not the hardware. Not the software. The data — the content you create. This is the content you can not get back again. This is the content that is unique. This is the content that needs to be backed up and saved against future calamity.

Because some of my data is saved in relational databases, the annual preservation process includes raw database dumps. Again, these are plain text files but in the form of SQL statements. Thank God for mysqldump. It gives me the opportunity to restore my Musings, my blog, my Alex Catalogue, my water collection, and now my Highlights & Annotations. (More on that later.)

Biblioteca Valenciana

All of the content above fits on a single CD. Easily. Again, I’m not that prolific of a writer.

The hard part is the multimedia. As a part of an Apple Library of Tomorrow grant awarded to me by Steve Cisler, I was given an Apple QuickTake camera in 1994 or so. It could store about 24 pictures in 256 colors. It broke when my wife accidentally dropped it into a pond. It still works, if you have the necessary Macintosh hardware and it is plugged in. Presently, I use a 5 megapixel camera. I take the pictures at the highest resolution. I take movies as well. The pictures get edited. The movies get edited as well. This content currently makes up the bulk of the CDs. Six for the movies saved in the Apple movie (.mov) format. One DVD for actual use. Three for the full-scale JPEG images. Three for the iPhoto CDs. While I feel confident the JPEG files will be readable into the future, I’m not so sure about the .mov files, let alone the DVD. I might feel better about some sort of MPEG format, but it seems to be continually changing. Similarly, I suppose I ought to be saving the JPEG files as PNG files. At least that way more of the metadata may be traveling along with the images. For even better preservation, I ought to be putting the movies on video tape. (There is no compression or encryption there). I ought to be printing the photographs on glossy paper and binding the whole lot into books.

This year I started saving my music. I’ve been recording myself playing guitar since 1984. It began with audio cassette tapes. I have about 30 of them labeled and stored away in plastic boxes. I’ve made a couple attempts to digitize them, but the process is very laborious. It is easier to record yourself digitally in the first place and save the resulting files. This year a rooted through my archives and found a number of recordings. Tests of new recording gear and software. Experiments in production techniques. Background music to home videos. Saved as AIFF files, I hope they will be readable in the future.

Once everything gets burnt to CDs, one copy becomes my working copy. The other copy goes to a CD case not to be touched. Soon I will need a new case.

Finally, everything is not digital. In fact, I print a lot. Print that thought-provoking email message. Print that essay. Print this blog posting. Print the code to that computer program. Sign and date the print out. Put it into the archival box. The number of boxes I’m accumulating is now up to about 10.

What can I say. I enjoy all aspects of librarianship.

Preservation

My world of (digital) preservation is miniscule compared to work of academic preservationists, archivists, and curators. If it takes this much effort to systematically collect, organize, and archive one person’s content, then think how much effort would be required to apply the process against the intellectual output of an entire college or university!

U of MN Archive
U of MN Archive

Even if so much people-power were available, this is no insurance against the future. How do we go about preserving digital content? What formats should the content be manifested in? What hardware will be needed to read the media where the data is saved? What software will be necessary to read the data? Too many questions. Too many unknowns. Too many things that are unpredictable. Right now, there only seems to be two solutions, and the real solution is probably a combination of the two. First, make sincere efforts to copy non-proprietary formats of content to physical media — a storage artifact that can be read by the widest variety of computer hardware. Plan on migrating the content as well as the physical media forward as technology changes. Think this process as an a type of insurance. Second, make as many copies of the content as possible in as many formats as possible. Print it. Microfilm it. Put it on tape and spinning disks. Make it available on the Web. While the folks at LOCKSS may not have thought the expression would be used in this manner, it is still true — “Lot’s of copies keep stuff safe.”

I sincerely believe we are in the process of creating a Digital Dark Age. “No, you can not read or access that content. It was created during the late 20th and early 21st centuries. It was a time of prolific exploration, few standards, and many legal barriers.” Something needs to happen differently.

Maybe it doesn’t really matter. Maybe the content that is needed is the content that always lives on “spinning disks” and gets automatically migrated forward. Computers make it easier to create lots of junk. It certainly doesn’t all need to be preserved. On the other hand, those letters from the American Civil War were not necessarily considered important at the time. Many of them were written by unknown people. Yet, these letters are important to us today. Not because of who wrote them, but because they reflect the thinking of the time. They provide pieces of a puzzle that can verify facts or provide alternative perspectives. After years and years, information can grow in importance, and consequently, today, we run the risk of throwing away stuff this is of importance tomorrow.

Preservationists have the hardest job in the field of librarianship. More power to them.

How to make a book (#2 of 3)

January 1st, 2010

This is the second of a three-part series on how to make a book.

The first posting described and illustrated how to use a thermo-binding machine to make a book. This posting describes and illustrates how to “weave” a book together — folding and cutting (or tearing). The process requires no tools. No glue. No sewing. Just paper. Ingenious. The third posting will be about traditional bookmaking.

Attribution

Like so many things in my life, I learned how to do this by reading a… book, but alas, I have misplaced this particular book and I am unable to provide you with a title/citation. (Pretty bad for a librarian!) In any event, the author of the book explained her love of bookmaking. She described her husband as an engineer who thought all of the traditional cutting, gluing, and sewing were unnecessary. She challenged him to create something better. The result was the technique described below. While what he created was not necessarily “better”, it surely showed ingenuity.

The process

Here is process outlined, but you can also see how it is done on YouTube:

  1. Begin with 12 pieces of paper – I use normal printer paper, but the larger 11.5 x 14 inch pieces of paper make for very nicely sized books.
  2. Fold pairs of paper length-wise – In the end, you will have 6 pairs of paper half as big as the originals.
  3. Draw a line down the center of 3 pairs – Demarcate where you will create “slots” for your book by drawing a line half the size of of the inner crease of 3 pairs of paper.
  4. Draw a line along the outside of 3 pairs – Demarcate where you will create “tabs” for your books by drawing two lines from one quarter along the crease towards the outside of the 3 pairs of paper.
  5. Cut along the lines – Actually create the slots and tabs of your books by cutting along the lines drawn in Steps #3 and #Instead of using scissors, you can tear along the creases. (No tools!)
  6. Create mini-books – Take one pair of paper cut as a tab and insert the tab into the slot of another pair. Do this for all of 3 of the slot-tab pairs. The result will be 3 mini-books simply “woven” together.
  7. Weave together the mini-books – Finally, find the slot of one of your mini-books and insert a tab from another mini-book. Do the same with the remaining mini-book.

The result of your labors should be a fully-functional book complete with 48 pages. I use them for temporary projects — notebooks. Yeah, the cover is not very strong. During the use of your book, put the whole thing in a manila or leather folder. Lastly, I know the process is difficult to understand without pictures. Watch the video.

Good and best open source software

December 28th, 2009

What qualities and characteristics make for a “good” piece of open source software? And once that question is answered, then what pieces of library-related open source software can be considered “best”?

I do not believe there is any single, most important characteristic of open source software that qualifies it to be denoted as “best”. Instead, a number of characteristics need to be considered. For example, a program might do one thing and do it well, but if it is bear to install then that counts against it. Similarly, some software might work wonders but it is built on a proprietary infrastructure such as a closed source compiler. Can that software really be considered “open”?

For my own education and cogitation, I have begun to list questions to help me address what I think is the “best” library-related open source software. Your comments would be greatly appreciated. I have listed the questions in (more or less) priority order:

  • Does the software work as advertised? – If the program says it can do one thing, but never does, then this may be a non-starter. On the other hand, accomplishing a particular goal is sometimes relative. In most cases the software might perform excellently, but in others it performs less so. It is unrealistic to expect any software to be all things to all people.
  • To what degree is the software supported? – Support, can mean many things. Most obviously, users of the software want to know whether or not there are one or more people behind the software who can answer questions about it. Where is the developer and how can I get in touch with them? Are they approachable? If the developer is not available, then can support be purchased? Do I get what I pay for when I make this purchase? How expensive is it? Is their website easy to use? Support can also allude to software updates. “Software is never done. If it were, then it would be called hardware.” For example, my favorite XSL processor (xsltproc) and some of its friends work great but recommending it to friends comes with hesitation because I wonder about ongoing maintenance and upgrades to the newer versions of the API. Support also means user community. While open source is about “free” software, it relies on communities for sustainability. Do such communities exist? Are there searchable mailing lists with browsable archives? Are there wikis, virtual and real meetings, and/or IRC channels, etc?
  • Is the documentation thorough? – Is there a man page? A POD? Something that can be printed and annotated? Is there an introduction? FAQ? Glossary of terms? Is there a different guide/section for different types of readers such as systems administrators, programmers, implementors, and/or users? Is the documentation well-written? While I have used plenty of pieces of software and never read the manual, documentation is essencial if the software is expected to be exploited to the highest degree. Few thing in life are truly intuitive. Software is certainly not one of them. Documentation is a form of writing, and writing is something that literally transcends space and time. It is an alternative to having a person giving you instructions.
  • What are the licence terms? – Personally I place a higher value on the viral nature of a GNU-like license, but BSD-like licenses enable commercial enterprise to a greater degree, and whether I like it or not commercial enterprises are all but necessary in the world I live in. (After all, it enabled the creation of favorite personal computer’s operating system.) At the same time, if the licensing is not GNU-like or BSD-like, then the software is not really open source anyway. Right?
  • To what degree is the software easy to install? – Since installing software is usually not a process that needs to be repeated, a difficult installation can be overlooked. On the other hand, if tweaking kernels, installing a huge number of dependencies, requiring a second piece of obscure software that is not supported is required, then all this counts against an open source software distribution.
  • To what degree is the software implemented using the “standard” LAMP stack? – LAMP is an acronym for Linux, Apache, MySQL, and Perl (or PHP, or Python, or just about any other computer language), and the LAMP stack is/was the basis for many pieces of open source applications. The combination is well-supported, well-documented, and easily transportable to different hardware platforms. If the software application is built on LAMP, then the application has a lot going for it.
  • Is the distribution in question an application/system or a library/module? – It is possible to divide software into two group: 1) software that is designed to build other software — libraries/modules, and 2) software that is an an end-in-itself — applications/systems. The former is akin to a tool in a toolbox used to build applications. The later is something intended for an end user. The former requires a computer programmer to truly exploit. The later usually does not require as much specific expertise. Both the module and the application have their place. Each have their own advantages and disadvantages. Depending on the implementor’s environment one might be better suited.
  • To what degree does the software satisfy some sort of real library need? – This question is specific to my particular audience, and is dependent on a definition of librarianship. Collection. Preservation. Organization. Dissemination. Books? Catalogs? Circulation? Reading and information literacy? Physical place fostering community? Etc. For example, librarians love to create lists, and in a digital environment lists are well managed through the use of relational databases. Therefore, does MySQL qualify as a piece of library-related software? Similarly, as Roy Tennant was told one time, “Librarians like to search. Everybody else likes to find.” Does this mean indexers like Solr/Lucene ought to qualify? Maybe the question ought to be rephrased. “To what degree does the software satisfy your or your institution’s needs?”

What sorts of things have I left out? Is there anything here that can be measurable or is everything left to subjective judgement? Just as importantly, can we as a community answer these questions in the list of specific software distributions to come up with the “best” of class?

‘More questions than answers.

Valencia and Madrid: A Travelogue

December 5th, 2009

I recently had the opportunity to visit Valencia and Madrid (Spain) to share some of my ideas about librarianship. This posting describes some of things I saw and learned along the way.

La Capilla de San Francisco de Borja
Capilla del Santo Cáliz

LIS-EPI Meeting

In Valencia I was honored to give the opening remarks at the 4th International LIS-EPI Meeting. Hosted by the Universidad Politécnica de Valencia and organized by Fernanda Mancebo as well as Antonia Ferrer, the Meeting provided an opportunity for librarians to come together and share their experiences in relation to computer technology. My presentation, “A few possibilities for librarianship by 2015” outlined a few near-term futures for the profession. From the introduction:

The library profession is at a cross roads. Computer technology coupled with the Internet have changed the way content is created, maintained, evaluated, and distributed. While the core principles of librarianship (collection, organization, preservation, and dissemination) are still very much apropos to the current milieu, the exact tasks of the profession are not as necessary as they once were. What is a librarian to do? In my opinion, there are three choices: 1) creating services against content as opposed to simply providing access to it, 2) curating collections that are unique to our local institutions, or 3) providing sets of services that are a combination of #1 and #2.

And from the conclusion:

If libraries are representing a smaller and smaller role in the existing information universe, then two choice present themselves. First, the profession can accept this fact, extend it out to its logical conclusion, and see that libraries will eventually play in insignificant role in society. Libraries will not be libraries at all but more like purchasing agents and middle men. Alternatively, we can embrace the changes in our environment, learn how to take advantage of them, exploit them, and change the direction of the profession. This second choice requires a period of transition and change. It requires resources spent against innovation and experimentation with the understanding that innovation and experimentation more often generate failures as opposed to successes. The second option carries with it greater risk but also greater rewards.

toro
toro
robot sculpture
robot sculpture

Josef Hergert

Providing a similar but different vision from my own, Josef Hergert (University of Applied Sciences HTW Chur) described how librarianship ought to be embracing Web 2.0 techniques in a presentation called “Learning and Working in Time of Web 2.0: Reconstructing Information and Knowledge”. To say Hergert was advocating information literacy would be to over-simplify his remarks, yet if you broaden the definition of information literacy to include the use of blogs, wikis, social bookmarking sites — Web 2.0 technologies — then the phrase information literacy is right on target. A number of notable quotes included:

  • We are experiencing many changes in the environment: non-commercial sharing of content, legislative overkill, and “pirate parties”… The definition of “authorship” is changing.
  • The teaching of information literacy courses will help overcome some of the problems.
  • The process of learning is changing because of the Internet… We are now experiencing a greater degree of informal learning as opposed to formal learning… We need as librarians to figure out how to exploit the environment to support learning both formal and informal.
  • The current environment is more than paper, but also about a network of people, and the librarian can help create these networks with [Web 2.0 tools].
  • Provide not only the book but the environment and tools to do the work.

As an aside, I have been using networked computer technologies for more than twenty years. Throughout that time a number of truisms have become apparent. “If you don’t want it copied, then don’t put it on the ‘Net; give back to the ‘Net”, “On the Internet nobody knows that you are a dog”, and “It is like trying to drink from a fire hose” are just a few. Hergert used the newest one, “If it is not on the Internet, then it doesn’t exist.” For better or for worse, I think this is true. Convenience is a very powerful elixer. The ease of acquiring networked data and information is so great compared the time and energy needed to get data and information in analog format that people will get what is simple “good enough”. In order to remain relevant, libraries must put their (full text) content on the ‘Net or be seen as an impediment to learning as opposed to learning’s facilitator.

While I would have enjoyed learning what the other Meeting presenters has to say, it was unrealistic for me to attend the balance of the conference. The translators were going back to Switzerland, and I would not have been able to understand what the presenters were saying. In this regard is sort of felt like the Ugly American, but I have come to realize that the use of English is a purely practical matter. It as nothing to do with a desire to understand American culture.

Bibliteca Valenciana

The next day I have a few others had the extraordinary opportunity to get an inside tour of the Bibliteca Valenciana (Valencia Library). Starting out as a monastery, it was transformed into quite a number of other things, such as a prison, before it became a library. We got to go into the archives, see of of their treasures, and learn about the library’s history. They were very proud of their Don Quixote collection, and we saw their oldest book — a treatise on the Black Death which included receipts for treatments.

Biblioteca Nacional de España

In Madrid I believe visited the Biblioteca Nacional de España (National Library of Spain) and went to their museum. It was free, and I saw an exhibition of original Copernicus, Galileo, Brahe, Kepler, and Newton editions embodying Western scientific progress. Very impressive, and very well done, especially considering the admission fee.

Biblioteca Nacional de España
Biblioteca Nacional
statue
statue

International Institute

Finally, I shared the presentation from the LIS-EPI Meeting at the International Institute. While I advocated changes in the way’s our profession do its work, the attendees at both venues wondered how to about these changes. “We are expected to provide a certain set of services to our patrons here and now. What do we do to learn these new skills?” My answer was grounded in applied research & development. Time must be spent experimenting and “playing” with the new technologies. This should be considered an investment in the profession and its personnel, an investment that will pay off later in new skills and greater flexibility. We work in academia. It behooves us to work academically. This includes explorations into applying our knowledge in new and different ways.

Acknowledgements

Many thanks go to many people for making this professional adventure possible. I am indebted to Monica Pareja from the United Stated Embassy in Madrid. She kept me out of trouble. I thank Fernanda Mancebo and Antonia Ferrer who invited me to the Meeting. Last and certainly not least, I thank my family for allowing to to go to Spain in the first place since the event happened over the Thanksgiving holiday. “Thank you, one and all.”

alley
alley
fountain
fountain

Colloquium on Digital Humanities and Computer Science: A Travelogue

December 4th, 2009

On November 14-16, 2009 I attended the 4th Annual Chicago Colloquium on Digital Humanities and Computer Science at the Illinois Institute of Technology in Chicago. This posting outlines my experiences there, but in a phrase, I found the event to be very stimulating. In my opinion, libraries ought to be embracing the techniques described here and integrating them into their collections and services.

IIT
IIT
Paul Galvin Library
Paul Galvin Library

Day #0 – A pre-conference workshop

Upon arrival I made my way directly to a pre-conference workshop entitled “Machine Learning, Sequence Alignment, and Topic Modeling at ARTFUL” presented by Mark Olsen and Clovis Gladstone. In the workshop they described at least two applications they were using to discover common phrases between texts. The first was called Philomine and the second was called Text::Pair. Both work similarly but Philomine needs to be integrated with Philologic, and Text::Pair is a stand-alone Perl module. Using these tools n-grams are extracted from texts, indexed to the file system, and await searching. By entering phrases into a local search engine, hits are returned that include the phrases and the works where the phrase was found. I believe Text::Pair could be successfully integrated in my Alex Catalogue.

orange, green, and gray
orange and green
orange and green

Day #1

The Colloquium formally began the next day with an introduction by Russell Betts (Illinois Institute of Chicago). His most notable quote was, “We have infinite computer power at our fingertips, and without much thought you can create an infinite amount of nonsense.” Too true.

Marco Büchler (University of Leipzig) demonstrated textual reuse techniques in a presentation called “Citation Detection and Textual Reuse on Ancient Greek Texts”. More specifically, he used textual reuse to highlight differences between texts, graph ancient history, and explore computer science algorithms. Try www.eaqua.net for more.

Patrick Juola‘s (Duquesne University) “conjecturator” was the heart of the next presentation called “Mapping Genre Spaces via Random Conjectures”. In short, Juola generated thousands and thousands of “facts” in the form of [subject1] uses [subject2] more or less than [subject3]. He then tested each of these facts for truth against a corpus. Ironically, he was doing much of what Betts alluded to in the introduction — creating nonsense. On the other hand, the approach was innovative.

By exploiting a parts-of-speech (POS) parser, Devin Griffiths (Rutgers University) sought the use of analogies as described in “On the Origin of Theories: The Semantic Analysis of Analogy in Scientific Corpus”. Assuming that an analogy can be defined as a noun-verb-noun-conjunction-noun-verb-noun phrase, Griffith looked for analogies in Darwin’s Origin of Species, graphed the number of analogies against locations in the text, and made conclusions accordingly. He asserted that the use of analogy was very important during the Victorian Age, and he tried to demonstrate this assertion through a digital humanities approach.

The use of LSIDs (large screen information displays) was discussed by Geoffrey Rockwell (McMaster University). While I did not take a whole lot of notes from this presentation, I did get a couple of ideas: 1) figure out a way for a person to “step into” a book, or 2) display a graphic representation of a text on a planetarium ceiling. Hmm…

Kurt Fendt (MIT) described a number of ways timelines could be used in the humanities in his presentation called “New Insights: Dynamic Timelines in Digital Humanities”. Through the process I became aware of the SIMILE timeline application/widget. Very nice.

I learned of the existence of a number of digital humanities grants as described by Michael Hall (NEH). They are both start-up grants as well a grants on advanced topics. See: neh.gov/odh/.

The first keynote speech, “Humanities as Information Sciences”, was given by Vasant Honavar (Iowa State University) in the afternoon. Honavar began with a brief history of thinking and philosophy, which he believes lead to computer science. “The heart of information processing is taking one string and transforming it into another.” (Again, think the introductory remarks.) He advocated the creation of symbols, feeding them into a processor, and coming up with solutions out the other end. Language, he posited, is an information-rich artifact and therefore something that can be analyzed with computing techniques. I liked how he compared science with the humanities. Science observes physical objects, and the humanities observe human creations. Honavar was a bit arscient, and therefore someone to be admired.

subway tunnel
subway tunnel
skyscraper predecessor

Day #2

In “Computational Phonostylistics: Computing the Sounds of Poetry” Marc Plamondon (Nipissing University) described how he was counting phonemes in both Tennyson’s and Browning’s poetry to validate whether or not Tennyson’s poetry is “musical” or plosive sounding and Browning’s poetry is “harsh” or fricative. To do this he assumed one set of characters are soft and another set are hard. He then counted the number of times each of these sets of characters existed in each of the respective poets’ works. The result was a graph illustrating the “musical” or “harshness” of the poetry. One of the more interesting quotes from Plamondon’s presentation included, “I am interested in quantifying aesthetics.”

In C.W. Forstal‘s (SUNY Buffalo) presentation “Features from Frequency: Authorship and Stylistic Analysis Using Repetitive Sound” we learned how he too is counting sound n-grams to denote style. He applied the technique to D.H. Lawrence as well as to the Iliad and Odyssey, and to his mind the technique works to his satisfaction.

The second keynote presentation was give by Stephen Wolfram (Wolfram Research) via teleconference. It was called “What Can Be Made Computable in the Humanities?” He began by describing Mathematica as a tool he used to explore the world around him. All of this assumes that the world consists of patterns, and these patterns can be described through the use of numbers. He elaborated through something he called the Principle of Computational Equivalency — once you get to a certain threshold systems create a level of complexity. Such a principle puts pressure on having the simplest descriptive model as possible. (Such things are standard scientific/philosophic principles. Nothing new here.) Looking for patterns was the name of his game, and one such game was applied to music. Discover the patterns in a type of music. Feed the patterns to a computer. Have the computer generate the music. Most of the time the output works pretty well. He called this WolframTones. He went on to describe WolframAlpha as an attempt to make the world’s knowledge computable. Essentially a front-end to Mathematica, WolframAlpha is a vast collection of content associated with numbers: people and their birth dates, the agriculture output of countries, the price of gold over time, temperatures from across the world, etc. Queries are accepted into the system. Searches are done against its content. Results are returned in the form of best-guess answers complete with graphs and charts. WolframAlpha exposes mathematical processing to the general public in ways that have not been done previously. Wolfram described two particular challenges in the creation of WolframAlpha. One was the collection of content. Unlike Google, Wolfram Research does not necessarily crawl the Internet. Rather it selectively collects the content of a “reference library” and integrates it into the system. Second, and more challenging, has been the design of the user interface. People do not enter structured queries, but structured output is expected. Interpreting people’s input is a difficult task in and of itself. From my point of view, he is probably learning more about human thought processes than the natural world.

red girder sculpture
gray sculpture
gray sculpture

Some thoughts

This meeting was worth every single penny, especially considering the fact that there was absolutely no registration fee. Free, except of the my travel costs, hotel, and the price of the banquet. Unbelievable!

Just as importantly, the presentations given at this meeting demonstrate the maturity of the digital humanities. These things are not just toys but practical tools for evaluating (mostly) texts. Given the increasing amount of full text available in library collections, I see very little reason why these sorts of digital humanities applications could not be incorporate into library collections and services. Collect full text content. Index it. Provide access to the index. Get back a set of search results. Select one or more items. Read them. Select one or more items again, and then select an option such as graph analogies, graph phonemes, or list common phrases between texts. People need to do more than read the texts. People need to use the texts, to analyze them, to compare & contrast them with other texts. The tools described in this conference demonstrate that such things are more than possible. All that has to be done is to integrate them into our current (library) systems.

So many opportunities. So little time.

Alex Catalogue collection policy

October 4th, 2009

This page lists the guidelines for including texts in the Alex Catalogue of Electronic Texts. Originally written in 1994, much of it is still valid today.

Purpose

The primary purpose of the Catalogue is to provide me with the means for demonstrating a concept I call arscience through American and English literature as well as Western philosophy. The secondary purpose of the Catalogue is to provide value-added access to some of the world’s great literature in turn providing the means for enhancing education. Consequently, the items in the collection must satisfy either of these two goals.

Qualities

Listed in priority order, texts in the collection must have the following qualities:

  1. Only texts in the public domain or freely distributed texts will be collected.
  2. Only texts that can be classified as American literature, English literature, or Western philosophy will be included.
  3. Only texts that are considered “great” literature will included. Great literature is broadly defined as literature withstanding the test of time and found in authoritative reference works like the Oxford Companions or the Norton Anthologies.
  4. Only complete works will be collected unless a particular work was never completed in the first place. In other words, partially digitized texts will not be included in the Catalogue.
  5. Whenever possible, collections of short stories or poetry will be included as they were originally published. If the items from the originally published collections have been broken up into individual stories or poems, then those items will be included individually.
  6. The texts in the collection must be written in or translated into English. Otherwise I will not be able to evaluate the texts’ quality nor will the indexing and content-searching work correctly.

File formats

Because of technical limitations and the potential long-term integrity of the Catalogue, texts in the collection, listed in order of preference, should have the following formats:

  1. Plain text files are preferred over HTML files.
  2. HTML files are preferred over compressed files.
  3. Compressed files are preferred over “word processor” files.
  4. Word processed files are the least preferable file format.
  5. Texts in unalterable file formats, such as Adobe Acrobat, will not be included.

In all cases, text that have not been divided into parts are preferred over texts that have been divided. If a particular item is deemed especially valuable and the item has been divided into parts, then efforts will be made to concatenate the individual parts and incorporate the result into the collection. The items in the collection are not necessarily intended to be read online.

Alex, the movie!

October 4th, 2009

Created circa 1998, this movie describes the purpose and scope of the Alex Catalogue of Electronic Texts. While coming off rather pompous, the gist of what gets said is still valid and correct. Heck, the links even work. “Thanks Berkeley!”

Collecting water and putting it on the Web (Part III of III)

September 3rd, 2009

This is Part III of an essay about my water collection, specifically a summary, opportunities for future study, and links to the source code. Part I described the collection’s whys and hows. Part II described the process of putting it on the Web.

Summary, future possibilities, and source code

There is no doubt about it. My water collection is eccentric but through my life time I have encountered four other people who also collect water. At least I am not alone.

Putting the collection on the Web is a great study in current technology. It includes relational database design. Doing input/output against the database through a programming language. Exploiting the “extensible” in XML by creating my own mark-up language. Using XSLT to transform the XML for various purposes: display as well as simple transformation. Literally putting the water collection on the map. Undoubtably technology will change, but the technology of my water collection is a representative reflection of the current use of computers to make things available on the Web.

I have made all the software a part of this system available here:

  1. SQL file sans any data – good for study of simple relational database
  2. SQL file complete with data – see how image data is saved in the database
  3. PHP scripts – used to do input/output against the database
  4. waters.xml – a database dump, sans images, in the form of an XML file
  5. waters.xsl – the XSLT used to display the browser interface
  6. waters2markers.xsl – transform water.xml into Google Maps XML file
  7. map.pl – implementation of Google Maps API

My water also embodies characteristics of librarianship. Collection. Acquisition. Preservation. Organization. Dissemination. The only difference is that the content is not bibliographic in nature.

There are many ways access to the collection could be improved. It would be nice to sort by date. It would be nice to index the content and make the collection searchable. I have given thought to transforming the WaterML into FO (Formatting Objects) and feeding the FO to a PDF processor like FOP. This could give me a printed version of the collection complete with high resolution images. I could transform the WaterML into an XML file usable by Google Earth providing another way to view the collection. All of these things are “left up the reader for further study”. Software is never done, nor are library collections.

River Lune
River Lune
Roman Bath
Roman Bath
Ogle Lake
Ogle Lake

Finally, again, why do I do this? Why do I collect the water? Why have a spent so much time creating a system for providing access to the collection? Ironically, I am unable to answer succinctly. It has something to do with creativity. It has something to do with “arsience“. It has something to do with my passion for the library profession and my ability to manifest it through computers. It has something to do with the medium of my art. It has something to do with my desire to share and expand the sphere of knowledge. “Idea. To be an idea. To be an idea and an example to others… Idea”. I really don’t understand it through and through.

Read all the posts in this series:

  1. The whys and hows of the water collection
  2. How the collection is put on the Web
  3. This post

Visit the water collection.

Collecting water and putting it on the Web (Part II of III)

September 3rd, 2009

This is Part II of an essay about my water collection, specifically the process of putting it on the Web. Part I describes the whys and hows of the collection. Part III is a summary, provides opportunities for future study, and links to the source code.

Making the water available on the Web

As a librarian, I am interested in providing access to my collection(s). As a librarian who has the ability to exploit the use of computers, I am especially interested in putting my collection(s) on the Web. Unfortunately, the process is not as easy as the actual collection process, and there have been a number of processes along the way. When I was really into HyperCard I created a “stack” complete with pictures of my water, short descriptions, and an automatic slide show feature that played the sound of running water in the background. (If somebody asks, I will dig up this dinosaur and make it available.) Later I created a Filemaker Pro database of the collection, but that wasn’t as cool as the HyperCard implementation.

Mississippi River
Mississippi River
Mississippi River
Mississippi River
Mississippi River
Mississippi River

The current implementation is more modern. It takes advantage of quite a number of technologies, including:

  • a relational database
  • a set of PHP scripts that do input/output against the database
  • an image processor to create thumbnail images
  • an XSL processor to generate a browsable Web presence
  • the Google Maps API to display content on a world map

The use of each of these technologies is described in the following sections.

Relational database


ER diagram

Since 2002 I have been adding and maintaining newly acquired waters in a relational, MySQL, database. (Someday I hope to get the waters out of those cardboard boxes and add them to the database too. Someday.) The database itself is rather simple. Four tables: one for the waters, one for the collectors, a join table denoting who collected what, and a metadata table consisting of a single record describing the collection as a whole. The entity-relationship diagram illustrates the structure of the database in greater detail.

Probably the most interesting technical characteristic of the database is the image field of type mediumblob in the waters table. When it comes to digital libraries and database design, one of the perennial choices to make is where to save your content. Saving it outside your database makes your database smaller and more complicated but forces you to maintain links to your file system or the Internet where the actual content resides. This can be an ongoing maintenance nightmare and can side-step the preservation issues. On the other hand inserting your content inside the database allows you to keep your content all in once place while “marrying” it to up in your database application. Putting the content in the database also allows you to do raw database dumps making the content more portable and easier to back-up. I’ve designed digital library systems both ways. Each has its own strengths and weaknesses. This is one of the rarer times I’ve put the content into the database itself. Never have I solely relied on maintaining links to off-site content. Too risky. Instead I’ve more often mirrored content locally and maintained two links in the database: one to the local cache and another to the canonical website.

PHP scripts for database input/output

Sets of PHP scripts are used to create, maintain, and report against the waters database. Creating and maintaining database records is tedious but not difficult as long as you keep in mind that there are really only four things you need to do with any database: 1) create records, 2) find records, 3) edit records, and 4) delete records. All that is required is to implement each of these processes against each of the fields in each of the tables. Since PHP was designed for the Web, each of these processes is implemented as a Web page only accessible to myself. The following screen shots illustrate the appearance and functionality of the database maintenance process.

ER diagram
Admin home
ER diagram
Admin waters
ER diagram
Edit water

High-level menus on the right. Sub-menus and data-entry forms in the middle. Simple. One of the nice things about writing applications for oneself is the fact that you don’t have to worry about usability, just functionality.

The really exciting stuff happens when the reports are written against the database. Both of them are XML files. The first is a essentially a database dump — water.xml — complete with the collection’s over-arching metadata record, each of the waters and their metadata, and a list of collectors. The heart of the report-writing process includes:

  1. finding all of the records in the database
  2. converting and saving each water’s image as a thumbnail
  3. initializing the water record
  4. finding all of the water’s collectors
  5. adding each collector to the record
  6. going to Step #5 for each collector
  7. finishing the record
  8. going to Step #2 for each water
  9. saving the resulting XML to the file system

There are two hard parts about this process. The first, “MOGRIFY”, is a shelled out hack to the operating system using an ImageMagik utility to convert the content of the image field into a thumbnail image. Without this utility saving the image from the database to the file system would be problematic. Second, the SELECT statement used to find all the collectors associated with a particular water is a bit tricky. Not really to difficult, just a typical SQL join process. Good for learning relational database design. Below is a code snippet illustrating the heart of this report-writing process:

  # process every found row
  while ($r = mysql_fetch_array($rows)) {
  
    # get, define, save, and convert the image -- needs error checking
    $image     = stripslashes($r['image']);
    $leafname  = explode (' ' ,$r['name']);
    $leafname  = $leafname[0] . '-' . $r['water_id'] . '.jpg';
    $original  = ORIGINALS  . '/' . $leafname;
    $thumbnail = THUMBNAILS . '/' . $leafname;
    writeReport($original, $image);
    copy($original, $thumbnail);
    system(MOGRIFY . $thumbnail);
          
    # initialize and build a water record
    $report .= '<water>';
    $report .= "<name water_id='$r[water_id]' lat='$r[lat]' lng='$r[lng]'>" . 
               prepareString($r['name']) . '</name>';
    $report .= '<date_collected>';
    $report .= "<year>$r[year]</year>";
    $report .= "<month>$r[month]</month>";
    $report .= "<day>$r[day]</day>";
    $report .= '</date_collected>';
    
    # find all the COLLECTORS associated with this water, and...
    $sql = "SELECT c.*
            FROM waters AS w, collectors AS c, items_for_collectors AS i
            WHERE w.water_id   = i.water_id
            AND c.collector_id = i.collector_id
            AND w.water_id     = $r[water_id]
            ORDER BY c.last_name, c.first_name";
    $all_collectors = mysql_db_query ($gDatabase, $sql);
    checkResults();
    
    # ...process each one of them
    $report .= "<collectors>";
    while ($c = mysql_fetch_array($all_collectors)) {
    
      $report .= "<collector collector_id='$c[collector_id]'><first_name>
                 $c[first_name]</first_name>
                 <last_name>$c[last_name]</last_name></collector>";
      
    }
    $report .= '</collectors>';
    
    # finish the record
    $report .= '<description>' . stripslashes($r['description']) . 
               '</description></water>';
  
  }

The result is the following “WaterML” XML content — a complete description of a water, in this case water from Copenhagen:

  <water>
    <name water_id='87' lat='55.6889' lng='12.5951'>Canal
      surrounding Kastellet, Copenhagen, Denmark
    </name>
    <date_collected>
      <year>2007</year>
      <month>8</month>
      <day>31</day>
    </date_collected>
    <collectors>
      <collector collector_id='5'>
        <first_name>Eric</first_name>
        <last_name>Morgan</last_name>
    </collector>
    </collectors>
    <description>I had the opportunity to participate in the
      Ticer Digital Library School in Tilburg, The Netherlands.
      While I was there I also had the opportunity to visit the
      folks at 
      <a href="http://indexdata.com">Index Data</a>, a company
      that writes and supports open source software for libraries.
      After my visit I toured around Copenhagen very quickly. I
      made it to the castle (Kastellet), but my camera had run out
      of batteries. The entire Tilburg, Copenhagen, Amsterdam
      adventure was quite informative.
    </description>
  </water>

When I first created this version of the water collection RSS was just coming on line. Consequently I wrote an RSS feed for the water, but then I got realistic. How many people want to get an RSS feed of my water. Crazy?!

XSL processing

Now that the XML file has been created an the images are saved to the file system, the next step is to make a browser-based interface. This is done though an XSLT style sheet and XSL processor called Apache2::TomKit.

Apache2::TomKit is probably the most eclectic component of my online water collection application. Designed to be a replacement for another XSL processor called AxKit, Apache2::TomKit enables the developer to create CGI-like applications, complete with HTTP GET parameters, in the form of XML/XSLT combinations. Specify the location of your XML files. Denote what XSLT files to use. Configure what XSLT processor to use. (I use LibXSLT.) Define an optional cache location. Done. The result is on-the-fly XSL transformations that work just like CGI scripts. The hard part is writing the XSLT.

The logic of my XSLT style sheet — waters.xsl — goes like this:

  1. Get input – There are two: cmd and id. Cmd is used to denote the desired display function. Id is used to denote which water to display
  2. Initialize output – This is pretty standard stuff. Display XHTML head elements and start the body.
  3. Branch – Depending on the value of cmd, display the home page, a collectors page, all the images, all the waters, or a specific water.
  4. Display the content – This is done with the thorough use of XPath expressions.
  5. Done – Complete the XHTML with a standard footer.

Of all the XSLT style sheets I’ve written in my career, waters.xsl is definitely the most declarative in nature. This is probably because the waters.xml file is really data driven as opposed mixed content. The XSLT file is very elegant but challenging for the typical Perl or PHP hacker to quickly grasp.

Once the integration of the XML file, the XSLT style sheet, and Apache2::TomKit is complete, I was able to design URL’s such as the following:

Okay. So its not very REST-ful; the URLs are not very “cool”. Sue me. I originally designed this in 2002.

Waters and Google Maps

In 2006 I used my water collection to create my first mash-up. It combined latitudes and longitudes with the Google Maps API.

Inserting maps into your Web pages via the Google API is a three-step process: 1) create an XML file containing latitudes and longitudes, 2) insert a call to the Google Maps javascript into the head of your HTML, and 3) call the javascript from within the body of your HTML.

For me, all I had to do was: 1) create new fields in my database for latitudes and longitudes, 2) go through each record in the database doing latitude and longitude data-entry, 3) write a WaterML file, 4) write an XSLT file transforming the WaterML into an XML file expected of Google Maps, 5) write a CGI script that takes latitudes and longitudes as input, 6) display a map, and 7) create links from my browser-based interface to the maps.

It may sound like a lot of steps, but it is all very logical, and taken bit by bit is relatively easy. Consequently, I am able to display a world map complete with pointers to all of my water. Conversely, I am able to display a water record and link its location to a map. The following two screen dumps illustrate the idea, and I try to get as close to the actual collection point as possible:

ER diagram
World map
ER diagram
Single water

Read all the posts in this series:

  1. The whys and hows of the water collection
  2. This post
  3. A summary, future directions, and source code

Visit the water collection.

Collecting water and putting it on the Web (Part I of III)

September 3rd, 2009

This is Part I of an essay about my water collection, specifically the whys and hows of it. Part II describes the process of putting the collection on the Web. Part III is a summary, provides opportunities for future study, and links to the source code.

I collect water

It may sound strange, but I have been collecting water since 1978, and to date I believe I have around 200 bottles containing water from all over the world. Most of the water I’ve collected myself, but much of it has also been collected by friends and relatives.

The collection began the summer after I graduated from high school. One of my best friends, Marlin Miller, decided to take me to Ocean City (Maryland) since I had never seen the ocean. We arrived around 2:30 in the morning, and my first impression was the sound. I didn’t see the ocean. I just heard it, and it was loud. The next day I purchased a partially melted glass bottle for 59¢ and put some water, sand, and air inside. I was going keep some of the ocean so I could experience it anytime I desired. (Actually, I believe my first water is/was from the Pacific Ocean, collected by a girl named Cindy Bleacher. She visited there in the late Spring of ’78, and I asked her to bring some back so I could see it too. She did.) That is how the collection got started.

Cape Cod Bay
Cape Cod Bay
Robins Bay
Robins Bay
Gulf of Mexico
Gulf of Mexico

The impetus behind the collection was reinforced in college — Bethany College (Bethany, WV). As a philosophy major I learned about the history of Western ideas. That included Heraclitus who believed the only constant was change, and water was the essencial element of the universe. These ideas were elaborated upon by other philosophers who thought there was not one essencial element, but four: earth, water, air, and fire. I felt like I was on to something, and whenever I heard of somebody going abroad I asked them bring me back some water. Burton Thurston, a Bethany professor, went to the Middle East on a diplomatic mission. He brought back Nile River water and water from the Red Sea. I could almost see Moses floating in his basket and escaping from the Egyptians.

The collection grew significantly in the Fall of 1982 because I went to Europe. During college many of my friends studied abroad. They didn’t do much studying as much as they did traveling. They were seeing and experiencing all of the things I was learning about through books. Great art. Great architecture. Cities whose histories go back millennia. Foreign languages, cultures, and foods. I wanted to see those things too. I wanted to make real the things I learned about in college. I saved my money from my summer peach picking job. My father cashed in a life insurance policy he had taken out on me when I was three weeks old. Living like a turtle with its house on its back, I did the back-packing thing across Europe for a mere six weeks. Along the way I collected water from the Seine at Notre Dame (Paris), the Thames (London), the Eiger Mountain (near Interlaken, Switzerland) where I almost died, the Agean Sea (Ios, Greece), and many other places. My Mediterranean Sea water from Nice is the prettiest. Because of the all the alge, the water from Venice is/was the most biologically active.

Over the subsequent years the collection has grown at a slower but regular pace. Atlantic Ocean (Myrtle Beach, South Carolina) on a day of playing hooky from work. A pond at Versailles while on my honeymoon. Holy water from the River Ganges (India). Water from Lock Ness. I’m going to grow a monster from DNA contained therein. I used to have some of a glacier from the Canadian Rockies, but it melted. I have water from Three Mile Island (Pennsylvania). It glows in the dark. Amazon River water from Peru. Water from the Missouri River where Lewis & Clarke decided it began. Etc.

Many of these waters I haven’t seen in years. Moves from one home to another have relegated them to cardboard boxes that have never been unpacked. Most assuredly some of the bottles have broken and some of the water has evaporated. Such is the life of a water collection.

Lake Huron
Lake Huron
Trg Bana Jelacica
Trg Bana Jelacica
Jimmy Carter Water
Jimmy Carter Water

Why do I collect water? I’m not quite sure. The whole body of water is the second largest thing I know. The first being the sky. Yet the natural bodies of water around the globe are finite. It would be possible to collect water from everywhere, but very difficult. Maybe I like the challenge. Collecting water is cheap, and every place has it. Water makes a great souvenir, and the collection process helps strengthen my memories. When other people collect water for me it builds between us a special relationship — a bond. That feels good.

What do I do with the water? Nothing. It just sits around my house occupying space. In my office and in the cardboard boxes in the basement. I would like to display it, but over all the bottles aren’t very pretty, and they gather dust easily. I sometimes ponder the idea of re-bottling the water into tiny vials and selling it at very expensive prices, but in the process the air would escape, and the item would lose its value. Other times I imagine pouring the water into a tub and taking a bath it it. How many people could say they bathed in the Nile River, Amazon River, Pacific Ocean, Atlantic Ocean, etc. all at the same time.

How water is collected

The actual process of collecting water is almost trivial. Here’s how:

  1. Travel someplace new and different – The world is your oyster.
  2. Identify a body of water – This should be endemic of the locality such as an ocean, sea, lake, pond, river, stream, or even a public fountain. Natural bodies of water a preferable. Processed water is not.
  3. Find a bottle – In earlier years this was difficult, and I usually purchased a bottle of wine with my meal, kept the bottle and cork, and used the combination as my container. Now-a-days it is easier to root round in a trash can for a used water bottle. They’re ubiquitous, and they too are often endemic of the locality.
  4. Collect the water – Just fill the bottle with mostly water but some of what the water is flowing over as well. The air comes along for the ride.
  5. Take a photograph – Hold the bottle at arm’s length and take a picture it. What you are really doing here is two-fold. Documenting the appearance of the bottle but also documenting the authenticity of the place. The picture’s background supports the fact that water really came from where the collector says.
  6. Label the bottle – On a small piece of paper write the name of the body of water, where it came from, who collected it, and when. Anything else is extra.
  7. Save – Keep the water around for posterity, but getting it home is sometimes a challenge. With the advent of 911 it is difficult to get the water through airport security and/or customs. I have recently found myself checking my bags and incurring a handling fee just to bring my water home. Collecting water is not as cheap as it used to be.

Who can collect water for me? Not just anybody. I have to know you. Don’t take it personally, but remember, part of the goal is relationship building. Moreover, getting water from strangers would jeopardize the collection’s authenticity. Is this really the water they say it is? Call it a weird part of the “collection development policy”.

Pacific Ocean
Pacific Ocean
Rock Run
Rock Run
Salton Sea
Salton Sea

Read all the posts in this series:

  1. This post
  2. How the collection is put on the Web
  3. A summary, future directions, and source code

Visit the water collection.

Web-scale discovery services

August 27th, 2009

Last week (Tuesday, August 18) Marshall Breeding and I participated in a webcast sponsored by Serials Solutions and Library Journal on the topic of “‘Web-scale’ discovery services”.

Our presentations complimented one another in that we both described the current library technology environment and described how the creation of amalgamated indexes of book and journal article content have the potential to improve access to library materials.

Dodie Ownes summarized the event in an article for Library Journal. From there you can also gain access to an archive of the one-hour webcast. (Free registration required.) I have made my written remarks available on the Hesburgh Libraries website as well as mirrored them locally. From the remarks:

It is quite possible the do-it-yourself creation and maintenance of an index to local book holdings, institutional repository content, and articles/etexts is not feasible. This may be true for any number of reasons. You may not have the full complement of resources to allocate, whether that be time, money, people, or skills. You and your library may have a set of priorities forcing the do-it-yourself approach lower on the to-do list. You might find yourself stuck in never-ending legal negotiations for content from “closed” access providers. You might liken the process of normalizing myriads of data formats into a single index to Hercules cleaning the Augean stables.

technical expertise
technical expertise
money
money
people with vision
people with vision
energy
energy

If this be the case, then the purchasing (read, “licensing”) of a single index service might be the next best thing — Plan B.

I sincerely believe the creation of these “Web-scale” indexes is a step in the right direction, but I believe just as strongly that the problem to be solved now-a-days does not revolve around search and discovery, but rather use and context.

“Thank you Serials Solutions and Library Journal for the opportunity to share some of my ideas.”